
Mathematics, 25.10.2020 19:40 jamya62
Please help me I suck at math and this is my only hope..
There are many measurements of the human body that are positively correlated. For example, the length of one's forearm (measured from elbow to wrist) is approximately the same length as the foot (measured from heel to toe). They are positively correlated because, as one measurement increases, so does the other measurement.
You will discover through this project whether a human's arm span (measured across the body with the arms extended) is correlated to his height.
You will need to collect data from 11 people, which will give you 12 data points including your own personal data. You will turn in and answer questions regarding only one scatter plot if doing the project alone. You may use the sample data provided in Part One if you do not have 11 people to measure.
1. Measure your own height and arm span (from finger-tip to finger-tip) in inches. You will likely need some help from a parent, guardian, or sibling to get accurate measurements. Record your measurements on the "Data Record" document. Use the "Data Record" to help you complete Part Two of this project.
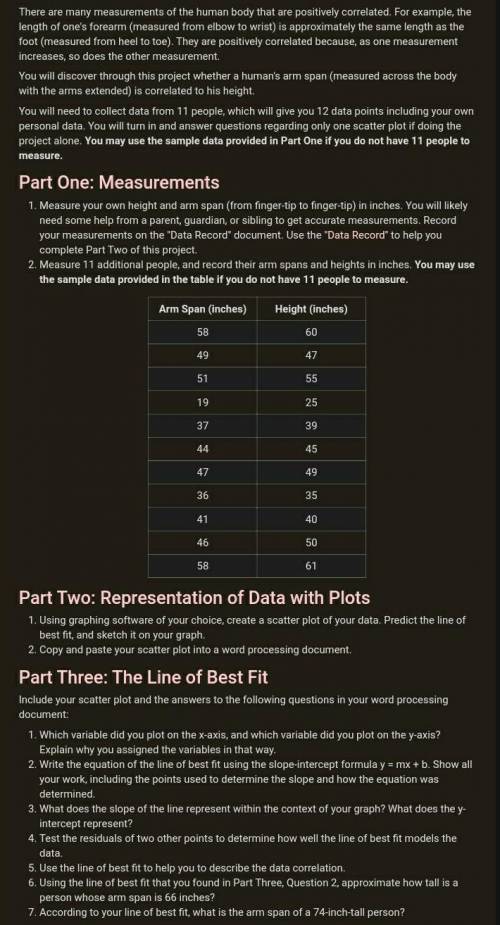
2. Measure 11 additional people, and record their arm spans and heights in inches. You may use the sample data provided in the table if you do not have 11 people to measure.
Using graphing software of your choice, create a scatter plot of your data. Predict the line of best fit, and sketch it on your graph. Copy and paste your scatter plot into a word processing document.
Include your scatter plot and the answers to the following questions in your word processing document:
Which variable did you plot on the x-axis, and which variable did you plot on the y-axis? Explain why you assigned the variables in that way. Write the equation of the line of best fit using the slope-intercept formula y = mx + b. Show all your work, including the points used to determine the slope and how the equation was determined. What does the slope of the line represent within the context of your graph? What does the y-intercept represent?Test the residuals of two other points to determine how well the line of best fit models the data. Use the line of best fit to help you to describe the data correlation. Using the line of best fit that you found in Part Three, Question 2, approximate how tall is a person whose arm span is 66 inches?According to your line of best fit, what is the arm span of a 74-inch-tall person?

Answers: 1
Another question on Mathematics
Mathematics, 21.06.2019 18:00
A. 90 degrees b. 45 degrees c. 30 degrees d. 120 degrees
Answers: 2
Mathematics, 21.06.2019 19:30
Asurvey of 45 teens found that they spent an average of 25.6 hours per week in front of a screen (television, computer, tablet, phone, based on the survey’s sample mean, which value could be the population mean? 2.3 hours 27.4 hours 75.3 hours 41.5 hours
Answers: 1
You know the right answer?
Please help me I suck at math and this is my only hope..
There are many measurements of the human b...
Questions
Mathematics, 07.01.2021 02:00

History, 07.01.2021 02:00

History, 07.01.2021 02:00
SAT, 07.01.2021 02:00
Mathematics, 07.01.2021 02:00
History, 07.01.2021 02:10


Physics, 07.01.2021 02:10

Computers and Technology, 07.01.2021 02:10
History, 07.01.2021 02:10
Mathematics, 07.01.2021 02:10


