
Mathematics, 27.10.2020 01:00 TerronRice
HELP PLEASE
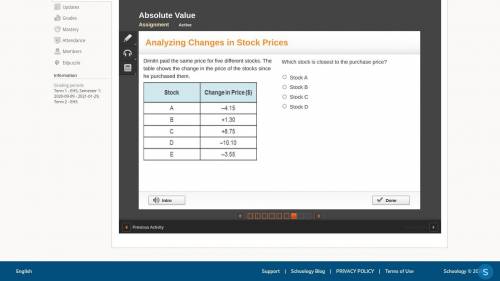
Dimitri paid the same price for five different stocks. The table shows the change in the price of the stocks since he purchased them.
A 2-column table with 5 rows. Column 1 is labeled Stock with entries A, B, C, D, E. Column 2 is labeled Change in price with entries negative 4.15, positive 1.30, positive 8.75, negative 10.10, negative 3.55.
Which stock is closest to the purchase price?
Stock A
Stock B
Stock C
Stock D

Answers: 1
Another question on Mathematics
Mathematics, 21.06.2019 15:00
Shryia read a 481 -page-long book cover to cover in a single session, at a constant rate. after reading for 1.5 hours, she had 403 pages left to read. how fast was shryia reading? pages per hour how long did it take her to read the entire book? hours plz i realy need this
Answers: 1
Mathematics, 21.06.2019 16:00
Part one: measurements 1. measure your own height and arm span (from finger-tip to finger-tip) in inches. you will likely need some from a parent, guardian, or sibling to get accurate measurements. record your measurements on the "data record" document. use the "data record" to you complete part two of this project. name relationship to student x height in inches y arm span in inches archie dad 72 72 ginelle mom 65 66 sarah sister 64 65 meleah sister 66 3/4 67 rachel sister 53 1/2 53 emily auntie 66 1/2 66 hannah myself 66 1/2 69 part two: representation of data with plots 1. using graphing software of your choice, create a scatter plot of your data. predict the line of best fit, and sketch it on your graph. part three: the line of best fit include your scatter plot and the answers to the following questions in your word processing document 1. 1. which variable did you plot on the x-axis, and which variable did you plot on the y-axis? explain why you assigned the variables in that way. 2. write the equation of the line of best fit using the slope-intercept formula $y = mx + b$. show all your work, including the points used to determine the slope and how the equation was determined. 3. what does the slope of the line represent within the context of your graph? what does the y-intercept represent? 5. use the line of best fit to you to describe the data correlation.
Answers: 2
Mathematics, 21.06.2019 17:00
Simone claims the initial value and y-intercept are the same thing on a graph. is she correct? if you know that a line has a slope of and a y-intercept of 7, what is the equation for that line in slope-intercept form?
Answers: 1
Mathematics, 21.06.2019 18:00
Write the fraction or mixed number and the decimal shown by the model
Answers: 2
You know the right answer?
HELP PLEASE
Dimitri paid the same price for five different stocks. The table shows the change in th...
Questions

Geography, 24.02.2021 08:30
Mathematics, 24.02.2021 08:30
Mathematics, 24.02.2021 08:30
Mathematics, 24.02.2021 08:30
Mathematics, 24.02.2021 08:30

Spanish, 24.02.2021 08:30
Mathematics, 24.02.2021 08:30
Mathematics, 24.02.2021 08:30

History, 24.02.2021 08:30

English, 24.02.2021 08:30

Social Studies, 24.02.2021 08:30

Biology, 24.02.2021 08:30
Mathematics, 24.02.2021 08:30


Biology, 24.02.2021 08:30
Mathematics, 24.02.2021 08:30


