Mathematics, 27.10.2020 19:10 penacesar18p9jrdh
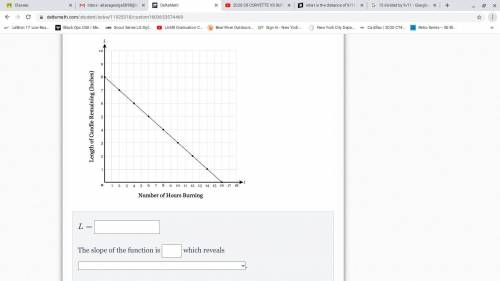
Kayla just lit a new candle and then let it burn all the way down to nothing. Let L represent the length of the candle remaining unburned, in inches, tt hours after candle was lit. A graph of L is shown below. Write an equation for L then state the slope of the graph and determine its interpretation in the context of the problem.


Answers: 2
Another question on Mathematics

Mathematics, 21.06.2019 19:30
Agarden consists of an apple tree, a pear tree, cauliflowers, and heads of cabbage. there are 40 vegetables in the garden. 24 of them are cauliflowers. what is the ratio of the number of cauliflowers to the number of heads of cabbage?
Answers: 2

Mathematics, 21.06.2019 21:00
Me! i will mark you brainliest if you are right and show your i don't get polynomials and all the other stuff. multiply and simplify.2x(^2)y(^3)z(^2) · 4xy(^4)x(^2)show your
Answers: 2

Mathematics, 21.06.2019 22:30
Julie was able to walk 16 km through the zoo in 6 hours. how long will it take her to walk 24 km through the zoo?
Answers: 2

Mathematics, 22.06.2019 02:00
1. the manager of collins import autos believes the number of cars sold in a day (q) depends on two factors: (1) the number of hours the dealership is open (h) and (2) the number of salespersons working that day (s). after collecting data for two months (53 days), the manager estimates the following log-linear model: q 4 equation 1 a. explain, how to transform the log-linear model into linear form that can be estimated using multiple regression analysis. the computer output for the multiple regression analysis is shown below: q4 table b. how do you interpret coefficients b and c? if the dealership increases the number of salespersons by 20%, what will be the percentage increase in daily sales? c. test the overall model for statistical significance at the 5% significance level. d. what percent of the total variation in daily auto sales is explained by this equation? what could you suggest to increase this percentage? e. test the intercept for statistical significance at the 5% level of significance. if h and s both equal 0, are sales expected to be 0? explain why or why not? f. test the estimated coefficient b for statistical significance. if the dealership decreases its hours of operation by 10%, what is the expected impact on daily sales?
Answers: 2
You know the right answer?
Kayla just lit a new candle and then let it burn all the way down to nothing. Let L represent the le...
Questions


English, 21.11.2020 04:20


English, 21.11.2020 04:20

Chemistry, 21.11.2020 04:20

Advanced Placement (AP), 21.11.2020 04:20


Mathematics, 21.11.2020 04:20


Geography, 21.11.2020 04:20

Social Studies, 21.11.2020 04:20

Mathematics, 21.11.2020 04:20


Mathematics, 21.11.2020 04:20


Spanish, 21.11.2020 04:20


Chemistry, 21.11.2020 04:20


