
Mathematics, 28.10.2020 02:30 hernandezbrandon059
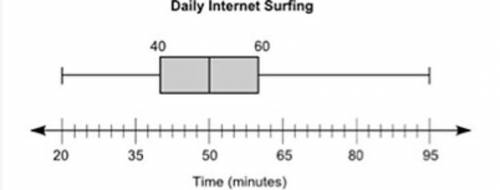
The box plot below shows the total amount of time, in minutes, the students of a class surf the Internet every day:
A box plot is shown. The left-most point on the plot is 20 and the right-most point is 95. The box is labeled 40 on the left edge and 60 on the right edge. A vertical line is drawn inside the rectangle at point 50.
Part A: List two pieces of information that are provided by the graph and one piece of information that is not provided by the graph. (4 points)
Part B: Calculate the interquartile range of the data, and explain in a sentence or two what it represents. (4 points)
Part C: Explain what affect, if any, there will be if an outlier is present. (2 points)

Answers: 3
Another question on Mathematics
Mathematics, 21.06.2019 20:00
The multiplicative property of equality states that for real numbers a, b, c, and d, if a = b and c = d, then ac = bd. true false
Answers: 1
Mathematics, 21.06.2019 22:30
Which of the following circles have their centers in the third quadrant? check all that apply.
Answers: 1
Mathematics, 21.06.2019 23:40
Me d is also an option but i couldn't get it in the picture
Answers: 2
You know the right answer?
The box plot below shows the total amount of time, in minutes, the students of a class surf the Inte...
Questions


Mathematics, 06.03.2020 02:40
Mathematics, 06.03.2020 02:41

History, 06.03.2020 02:42
Mathematics, 06.03.2020 02:42


Mathematics, 06.03.2020 02:42


