
Mathematics, 29.10.2020 05:20 vanessagallegos7445
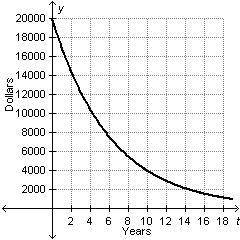
The graph below models the value of a $20,000 car t years after it was purchased. Value of Car A graph titled Value of Car has years on the x-axis and Dollars on the y-axis. A line curves down and goes through points (0, 20,000), (4, 10,000), and (14, 2,000). Which statement best describes why the value of the car is a function of the number of years since it was purchased? Each car value, y, is associated with exactly one time, t. Each time, t, is associated with exactly one car value, y. The rate at which the car decreases in value is not constant. There is no time, t, at which the value of the car is 0.

Answers: 2
Another question on Mathematics
Mathematics, 21.06.2019 18:00
What is the rate of change of a line that passes through (2,-5) and (6,-2)?
Answers: 2
Mathematics, 21.06.2019 22:50
Jim had 15 minutes to do 5 laps around his school what would his time be
Answers: 1
You know the right answer?
The graph below models the value of a $20,000 car t years after it was purchased. Value of Car A gra...
Questions

English, 07.02.2021 18:30

Social Studies, 07.02.2021 18:30
Mathematics, 07.02.2021 18:30


History, 07.02.2021 18:30

Biology, 07.02.2021 18:30
Social Studies, 07.02.2021 18:30


English, 07.02.2021 18:30

History, 07.02.2021 18:30
Mathematics, 07.02.2021 18:30
Mathematics, 07.02.2021 18:30
Social Studies, 07.02.2021 18:30


