
Mathematics, 02.11.2020 22:40 gungamer720
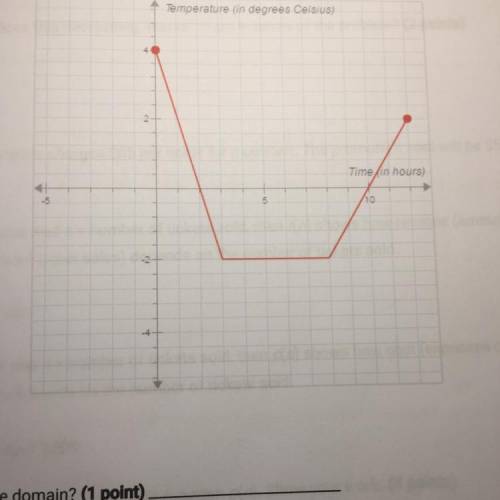
This graph shows the outside temperature (in degrees Celsius) over the course of 12 hours, starting at midnight (x = 0).
Part I:
a) What is the domain
b) What does the domain mean in terms of the problem
Part II:
a) What is the range?
b) What does the range mean in terms of the problem?
Part III:
a) When is the function decreasing?
b) What does this decreasing interval mean in terms of the problem?
Please help!!

Answers: 1
Another question on Mathematics
Mathematics, 21.06.2019 14:00
Acompany is testing in comparing to lightbulb designs the box plot shows the number of hours that each lightbulb design last before burning out which statement is best supported by the information of the plot
Answers: 3
Mathematics, 21.06.2019 20:00
Elizabeth is using a sample to study american alligators. she plots the lengths of their tails against their total lengths to find the relationship between the two attributes. which point is an outlier in this data set?
Answers: 1
Mathematics, 22.06.2019 00:00
Which of the following are arithmetic sequences? check all that apply. a. 0.3, 0.6, 0.9, 1.2, 1.5, b. 2, 3, 6, 11, 18, c. 150, 147, 144, 142, d. 2, 4, 9, 16, 25,
Answers: 1
Mathematics, 22.06.2019 02:00
Find the distance of the blue line between the two labeled points. round to the nearest hundredth. a) 7.07 b) 7.21 c) 10 d) 5.12
Answers: 3
You know the right answer?
This graph shows the outside temperature (in degrees Celsius) over the course of 12 hours, starting...
Questions

History, 07.01.2021 21:10
Mathematics, 07.01.2021 21:10

Mathematics, 07.01.2021 21:10
English, 07.01.2021 21:10
Mathematics, 07.01.2021 21:10
Mathematics, 07.01.2021 21:10
Mathematics, 07.01.2021 21:10

English, 07.01.2021 21:10
History, 07.01.2021 21:10

Arts, 07.01.2021 21:10
Mathematics, 07.01.2021 21:10

Health, 07.01.2021 21:10
Mathematics, 07.01.2021 21:10


