
Mathematics, 03.11.2020 02:30 necolewiggins1043
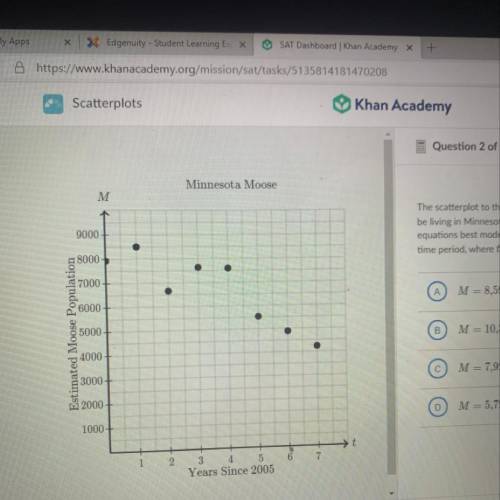
The scatterplot to the left shows the number of moose, M, estimated to
be living in Minnesota from 2005 to 2012. Which of the following
equations best models the population of moose in Minnesota during this
time period, where t represents the years since 2005?
А
M= 8,593-563t
B
M = 10,343 – 1,842t
M= 7,923 +578t
D
M=5,725 + 467

Answers: 2
Another question on Mathematics
Mathematics, 20.06.2019 18:02
Factor completely. x^8 - 1/81 a) (x^4 + 1/9)(x^2 + 1/3)(x^2 - 1/3) b) (x^4 - 1/9)(x^2 + 1/3)(x^2 - 1/3) c) (x^4 + 1/9)(x^2 - 1/3)2
Answers: 3
Mathematics, 21.06.2019 16:00
You paint a 1/2 of a wall in 1/4 hour. how long will it take you to paint one wall
Answers: 2
Mathematics, 22.06.2019 01:00
In a tutoring session, 2/3 of an hour was spent reviewing math problems. adelina attended 3/4 of the tutoring session. how much time did adelina spend at the tutoring session?
Answers: 2
Mathematics, 22.06.2019 03:00
Aboat has a speed of 9 mph in calm water. it takes the boat 4 hours to travel upstream but only 2 hours to travel the same distance downstream. which equation can be used to find c, the speed of the current? 2(9 – c) = 4(9 + c) 9 + c = 4(9 – c) 9 – c = 2(9 + c) 4(9 – c) = 2(9 + c)
Answers: 3
You know the right answer?
The scatterplot to the left shows the number of moose, M, estimated to
be living in Minnesota from...
Questions


Biology, 20.08.2019 23:40


Mathematics, 20.08.2019 23:40

Social Studies, 20.08.2019 23:40

Computers and Technology, 20.08.2019 23:40
Mathematics, 20.08.2019 23:40
Biology, 20.08.2019 23:40

Mathematics, 20.08.2019 23:40

History, 20.08.2019 23:40


