
Mathematics, 04.11.2020 07:50 alayciaruffin076
Question 4
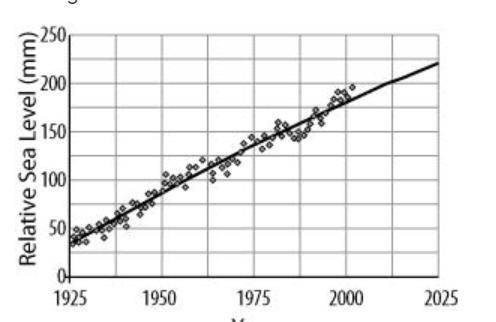
The figure shows the actual increase in sea level between the years 1925 and 2000 (shown by the points) and a mathematical model that has been fitted to the data (shown by the line).
image 5afdca68eca248c59dbe6c57ceabf51b
Based on the model in the graph, which is the best estimate of the average annual increase in sea level expected between the years 2000 and 2025?
A
1.6 mm/year
B
1.9 mm/year
C
40 mm/year
D
150 mm/year

Answers: 3
Another question on Mathematics
Mathematics, 21.06.2019 12:50
What is the equation of the linear function represented by the table?
Answers: 1
Mathematics, 21.06.2019 23:40
The bolo cavern outside of vandalia is 421 ft below sea level. a little more than75 miles away. mt owens is 7295 feet above sea level. what is the difference in elevation between the bolo cavern and mt owens?
Answers: 1
Mathematics, 22.06.2019 01:00
Jack is considering a list of features and fees for current bank: jack plans on using network atms about 4 times per month. what would be jack’s total estimated annual fees for a checking account with direct paycheck deposit, one overdraft per year, and no 2nd copies of statements? a. $44 b. $104 c. $144 d. $176
Answers: 1
Mathematics, 22.06.2019 02:30
Which problem would you use the following proportion to solve for? 24/x=40/100 a. what is 40% of 24? b. what percent is 24 of 40? c. twenty-four is 40% of what number? d. forty percent of 24 is what number?
Answers: 3
You know the right answer?
Question 4
The figure shows the actual increase in sea level between the years 1925 and 2000 (shown...
Questions

Computers and Technology, 01.12.2020 16:50

English, 01.12.2020 16:50

History, 01.12.2020 16:50
Mathematics, 01.12.2020 16:50


Computers and Technology, 01.12.2020 16:50
Computers and Technology, 01.12.2020 16:50

Mathematics, 01.12.2020 16:50

Social Studies, 01.12.2020 16:50
Mathematics, 01.12.2020 16:50


