
Mathematics, 05.11.2020 22:50 lunaandrew332
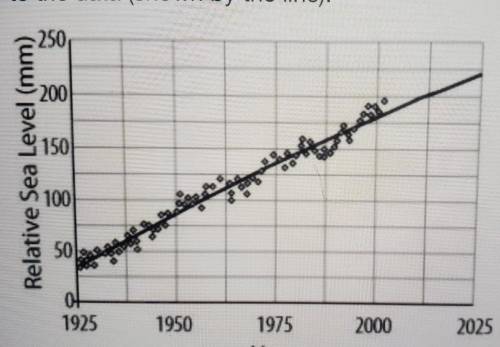
Tools - ABC The figure shows the actual increase in sea level between the years 1925 and 2000 (shown by the points) and a mathematical model that has been fitted to the data (shown by the line). 250 200 150 Relative Sea Level (mm) Hotel 10ܣ925 1950 2000 2025 1975 Year Based on the model in the graph, which is the best estimate of the average annual increase in sea level expected between the years 2000 and 2025? А 1.6 mm/year B 1.9 mm/year С 40 mm/year D 150 mm/year 2020 Illuminate Education TM, Inc. Time Remaining: 1 hour,

Answers: 1
Another question on Mathematics
Mathematics, 20.06.2019 18:04
Choose all answers that apply: a) ab and a’b’ are one the same line. b) quadrilaterals abcd and a’ b’ c’ d’ have the same perimeters. c) points a and a’ have the same coordinates. d) none of the above
Answers: 3
Mathematics, 21.06.2019 22:30
An ant travels at a constant rate of 30cm every 2 minutes.at what speed does the ant travel per minute
Answers: 2
Mathematics, 22.06.2019 00:10
The mass of a marine organism, in pounds, p years after it is born is given by the polynomial function r(p) = -4p2 + 300p. find the mass when p = 20 years.
Answers: 1
Mathematics, 22.06.2019 00:20
When steve woke up. his temperature was 102 degrees f. two hours later it was 3 degrees lower. what was his temperature then?
Answers: 1
You know the right answer?
Tools - ABC The figure shows the actual increase in sea level between the years 1925 and 2000 (shown...
Questions


Mathematics, 19.03.2020 01:02
Mathematics, 19.03.2020 01:02

Chemistry, 19.03.2020 01:02

Computers and Technology, 19.03.2020 01:02

History, 19.03.2020 01:02
Mathematics, 19.03.2020 01:02


