
Mathematics, 06.11.2020 20:50 lucretiak74
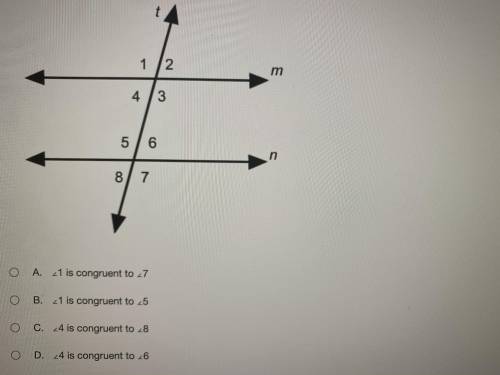
Use the law of detachment to make a conclusion, if a transversal crosses parallel lines then alternate exterior angles are congruent, line t crosses parallel lines m and n which one of the multiple choice answers are correct

Answers: 1
Another question on Mathematics
Mathematics, 21.06.2019 14:20
Simplify 6sin θsec θ. choices a) 6 tan θ b) 6 cos θ c) 6 cot θ d) 6
Answers: 2
Mathematics, 21.06.2019 21:30
Questions 9-10. use the table of educational expenditures to answer the questions. k-12 education expenditures population indiana $9.97 billion 6.6 million illinois $28.54 billion 12.9 million kentucky $6.58 billion 4.4 million michigan $16.85 billion 9.9 million ohio $20.23 billion 11.6million 9. if the amount of k-12 education expenses in indiana were proportional to those in ohio, what would have been the expected value of k-12 expenditures in indiana? (give the answer in billions rounded to the nearest hundredth) 10. use the value of k-12 education expenditures in michigan as a proportion of the population in michigan to estimate what the value of k-12 education expenses would be in illinois. a) find the expected value of k-12 expenditures in illinois if illinois were proportional to michigan. (give the answer in billions rounded to the nearest hundredth) b) how does this compare to the actual value for k-12 expenditures in illinois? (lower, higher, same? )
Answers: 1
Mathematics, 21.06.2019 23:30
The volume of a box varies directly with its length if a box in the group has a length of 30inches and k=24 what is its volume
Answers: 1
Mathematics, 22.06.2019 01:00
The weight of 46 new patients of a clinic from the year 2018 are recorded and listed below. construct a frequency distribution, using 7 classes. then, draw a histogram, a frequency polygon, and an ogive for the data, using the relative information from the frequency table for each of the graphs. describe the shape of the histogram. data set: 130 192 145 97 100 122 210 132 107 95 210 128 193 208 118 196 130 178 187 240 90 126 98 194 115 212 110 225 187 133 220 218 110 104 201 120 183 124 261 270 108 160 203 210 191 180 1) complete the frequency distribution table below (add as many rows as needed): - class limits - class boundaries - midpoint - frequency - cumulative frequency 2) histogram 3) frequency polygon 4) ogive
Answers: 1
You know the right answer?
Use the law of detachment to make a conclusion, if a transversal crosses parallel lines then alterna...
Questions
Mathematics, 23.06.2019 04:31


Biology, 23.06.2019 04:31

Physics, 23.06.2019 04:31

History, 23.06.2019 04:31
Physics, 23.06.2019 04:31
Mathematics, 23.06.2019 04:31
Mathematics, 23.06.2019 04:31
History, 23.06.2019 04:31


