
Mathematics, 06.11.2020 22:50 s61371
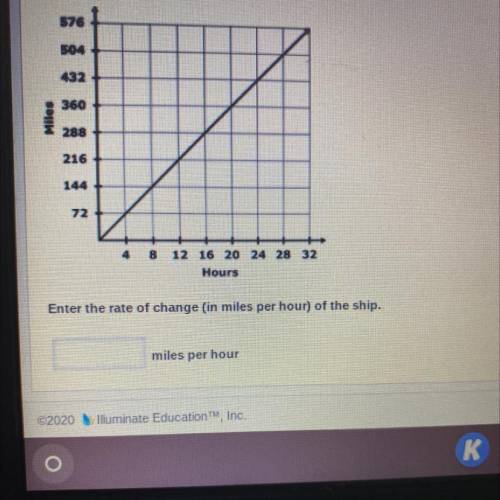
A ship is sailing from New York to London. Every 4 hours, the captain plots the total distance that the ship has traveled (in mile) on a graph. The captain then connects these points to form the line shown on the graph below. Enter the rate of change (in miles per hour) of the ship

Answers: 1
Another question on Mathematics
Mathematics, 21.06.2019 18:00
The sat and act tests use very different grading scales. the sat math scores follow a normal distribution with mean 518 and standard deviation of 118. the act math scores follow a normal distribution with mean 20.7 and standard deviation of 5. suppose regan scores a 754 on the math portion of the sat. how much would her sister veronica need to score on the math portion of the act to meet or beat regan's score?
Answers: 1
Mathematics, 21.06.2019 22:30
The track team ran a mile and a quarter during their practice how many kilometers did her team runs?
Answers: 1
Mathematics, 22.06.2019 00:00
The construction of copying qpr is started below. the next step is to set the width of the compass to the length of ab. how does this step ensure that a new angle will be congruent to the original angle?
Answers: 1
Mathematics, 22.06.2019 01:30
This graph shows a portion of an odd function. use the graph to complete the table of values. x f(x) −2 −3 −4 −6 im sorry i cant get the graph up
Answers: 1
You know the right answer?
A ship is sailing from New York to London. Every 4 hours, the captain plots the total distance that...
Questions

Mathematics, 05.10.2020 01:01

Mathematics, 05.10.2020 01:01

Social Studies, 05.10.2020 01:01
Mathematics, 05.10.2020 01:01

Mathematics, 05.10.2020 01:01
History, 05.10.2020 01:01
Mathematics, 05.10.2020 01:01
Mathematics, 05.10.2020 01:01
Mathematics, 05.10.2020 01:01
Mathematics, 05.10.2020 01:01


