
Mathematics, 07.11.2020 04:50 shaeelynn3734
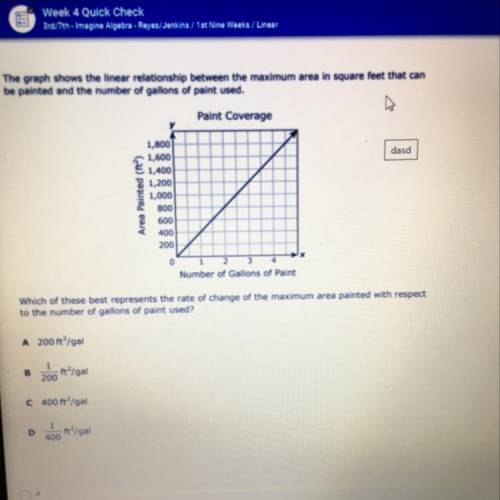
The graph shows the linear relationship between the maximum area in square feet that can
be painted and the number of gallons of paint used.
Paint Coverage
dasd
1,000
1,600
1,400
21,200
1,000
800
600
400
200
0
Number of Gallons of Paint
Which of these best represents the rate of change of the maximum area painted with respect
to the number of gallons of paint used?
A 200ft/gal
200 m2 /981
C 400 ft/gal
D.00 n 1981

Answers: 1
Another question on Mathematics
Mathematics, 21.06.2019 13:00
Which statement best describes the expression 4y ÷ 9? (1 point) 9 divided by 4 times y 9 times y divided by 4 4 times y divided by 9 4 divided by 9 times y
Answers: 1
Mathematics, 21.06.2019 18:30
Which of the following correctly justifies statement four of the two column proof? a. corresponding angles theorem b. transitive property of equality c. vertical angle theorem d. substitution property of equality
Answers: 1
Mathematics, 21.06.2019 20:30
Someone me what is the area of this figure? 18m 18m 8m 16m
Answers: 2
Mathematics, 21.06.2019 22:30
There were 25 students who answered to a survey about sports. four-fifths of them like football. how many students like football?
Answers: 2
You know the right answer?
The graph shows the linear relationship between the maximum area in square feet that can
be painted...
Questions

Mathematics, 06.11.2020 05:10

Arts, 06.11.2020 05:10
Mathematics, 06.11.2020 05:10
Mathematics, 06.11.2020 05:10

Business, 06.11.2020 05:10

History, 06.11.2020 05:10

Mathematics, 06.11.2020 05:10
Mathematics, 06.11.2020 05:10

English, 06.11.2020 05:10
English, 06.11.2020 05:10

Physics, 06.11.2020 05:10

English, 06.11.2020 05:10


