
Mathematics, 11.11.2020 23:20 kkjjstar2011
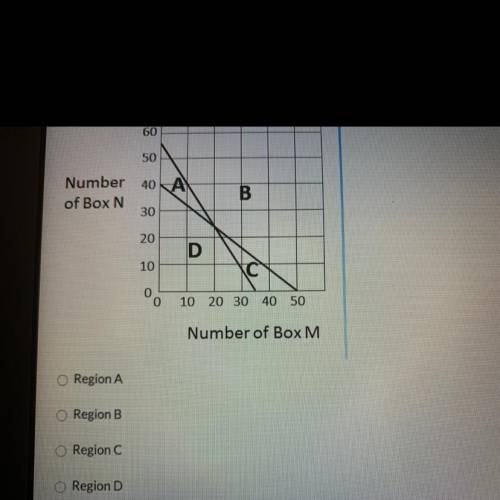
A candy company sells two different boxes of chocolates, Box M and Box N. Box M contains 12 caramels and 8 coconuts, and Box N contains 15 caramels and
5 coconuts. Let x represent the number of Box M produced and let y represent the number of Box N produced. The graph representing the production of
these boxes is shown below. The lines divide the area of the graph into 4 regions, labeled A, B, C and D.
If the company wishes to include no more than 60
0 caramels and no less than 280 coconuts each day, which of the regions in the graph represents the
numbers of each type of box that can be produced daily?
PLEASE HELP ME!!!

Answers: 2
Another question on Mathematics
Mathematics, 22.06.2019 00:30
The base of the rectangle pyramid is 13 inches long and 12 inches wide the height of the pyramid is 18 inches . what is the volume of the pyramid ?
Answers: 2
Mathematics, 22.06.2019 01:00
Select the correct answer from each drop-down menu the equation of a line is 3/5*+1/3y=1/15
Answers: 2
You know the right answer?
A candy company sells two different boxes of chocolates, Box M and Box N. Box M contains 12 caramels...
Questions


Geography, 17.10.2019 00:30

Chemistry, 17.10.2019 00:30
English, 17.10.2019 00:30


Biology, 17.10.2019 00:30
Mathematics, 17.10.2019 00:30

Social Studies, 17.10.2019 00:30
Social Studies, 17.10.2019 00:30
Mathematics, 17.10.2019 00:30
History, 17.10.2019 00:30


