Mathematics, 12.11.2020 16:20 erickamiles1797
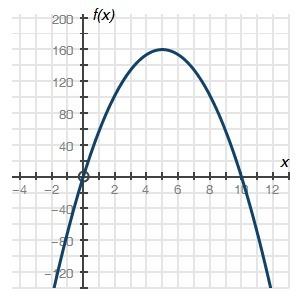
The scatter plot shows the time spent studying ,x, and the midterm score, y, for each of 25 students. Use the equation of the line of best fit, y=3.85x+15.60, to answer the questions below. Give exact answers, not rounded approximations. (A) What is the predicted midterm score for a student who doesn't spend any time studying? (B) What is the predicted midterm score for a student who studies for 15 hours? (C) For an increase of one hour in the time spent studying, what is the predicted increase in the midterm score?

Answers: 1
Another question on Mathematics


Mathematics, 21.06.2019 16:00
Enter the number of complex zeros for the polynomial function f(x) = x 4+ 5x² +6
Answers: 2


Mathematics, 21.06.2019 17:50
Find the cosine function that is represented in the graph.
Answers: 1
You know the right answer?
The scatter plot shows the time spent studying ,x, and the midterm score, y, for each of 25 students...
Questions

History, 03.10.2019 09:30


Mathematics, 03.10.2019 09:50

Chemistry, 03.10.2019 09:50


History, 03.10.2019 09:50

Mathematics, 03.10.2019 09:50

English, 03.10.2019 09:50


Arts, 03.10.2019 09:50

Mathematics, 03.10.2019 09:50

History, 03.10.2019 09:50


