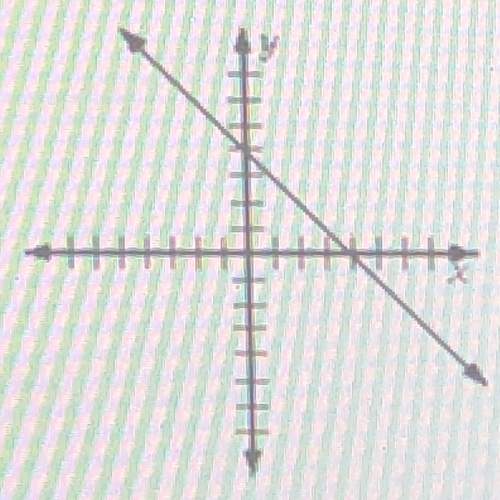
Which linear inequality is represented by the graph?
2x + 4
+ 3
y = 2 x + 3
y: 2x...

Mathematics, 13.11.2020 20:40 amya92
Which linear inequality is represented by the graph?
2x + 4
+ 3
y = 2 x + 3
y: 2x + 3

Answers: 2
Another question on Mathematics
Mathematics, 21.06.2019 19:40
Afactory makes propeller drive shafts for ships. a quality assurance engineer at the factory needs to estimate the true mean length of the shafts. she randomly selects four drive shafts made at the factory, measures their lengths, and finds their sample mean to be 1000 mm. the lengths are known to follow a normal distribution whose standard deviation is 2 mm. calculate a 95% confidence interval for the true mean length of the shafts. input your answers for the margin of error, lower bound, and upper bound.
Answers: 3
Mathematics, 21.06.2019 21:00
From the beginning of the day the temperature rose 15 degrees so that by 4 pm it was 87 degrees. what was the temperature at the start of the day
Answers: 1
You know the right answer?
Questions

Physics, 28.01.2021 23:40
Mathematics, 28.01.2021 23:40

SAT, 28.01.2021 23:40
Mathematics, 28.01.2021 23:40

Mathematics, 28.01.2021 23:40

Mathematics, 28.01.2021 23:40
Mathematics, 28.01.2021 23:40
Mathematics, 28.01.2021 23:40
Mathematics, 28.01.2021 23:40
English, 28.01.2021 23:40

Mathematics, 28.01.2021 23:40
Mathematics, 28.01.2021 23:40
Spanish, 28.01.2021 23:40

Arts, 28.01.2021 23:40


