
Mathematics, 16.11.2020 02:50 kenleighbrooke67
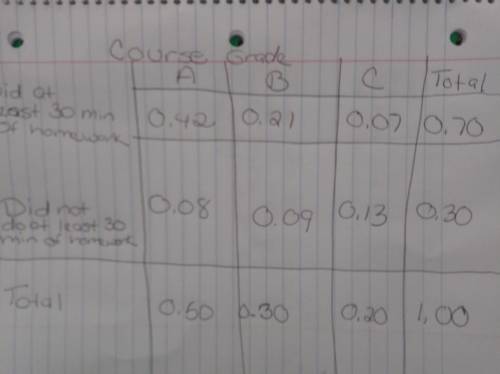
Construct a Venn diagram of the probabilities from the teacher's survey. Based on the probabilities, are the events "course grade was a C" and "did at least 30 minutes of homework" independent? Explain your answer.

Answers: 2
Another question on Mathematics
Mathematics, 21.06.2019 22:00
After a dreary day of rain, the sun peeks through the clouds and a rainbow forms. you notice the rainbow is the shape of a parabola. the equation for this parabola is y = -x2 + 36. graph of a parabola opening down at the vertex 0 comma 36 crossing the x–axis at negative 6 comma 0 and 6 comma 0. in the distance, an airplane is taking off. as it ascends during take-off, it makes a slanted line that cuts through the rainbow at two points. create a table of at least four values for the function that includes two points of intersection between the airplane and the rainbow. analyze the two functions. answer the following reflection questions in complete sentences. what is the domain and range of the rainbow? explain what the domain and range represent. do all of the values make sense in this situation? why or why not? what are the x- and y-intercepts of the rainbow? explain what each intercept represents. is the linear function you created with your table positive or negative? explain. what are the solutions or solution to the system of equations created? explain what it or they represent. create your own piecewise function with at least two functions. explain, using complete sentences, the steps for graphing the function. graph the function by hand or using a graphing software of your choice (remember to submit the graph).
Answers: 2
Mathematics, 21.06.2019 22:50
Ur environment is very sensitive to the amount of ozone in the upper atmosphere. the level of ozone normally found is 4.04.0 parts/million (ppm). a researcher believes that the current ozone level is not at a normal level. the mean of 2525 samples is 4.44.4 ppm with a standard deviation of 0.80.8. assume the population is normally distributed. a level of significance of 0.020.02 will be used. make the decision to reject or fail to reject the null hypothesis. answer tables
Answers: 3
Mathematics, 22.06.2019 00:00
(20 points) a bank has been receiving complaints from real estate agents that their customers have been waiting too long for mortgage confirmations. the bank prides itself on its mortgage application process and decides to investigate the claims. the bank manager takes a random sample of 20 customers whose mortgage applications have been processed in the last 6 months and finds the following wait times (in days): 5, 7, 22, 4, 12, 9, 9, 14, 3, 6, 5, 15, 10, 17, 12, 10, 9, 4, 10, 13 assume that the random variable x measures the number of days a customer waits for mortgage processing at this bank, and assume that x is normally distributed. 2a. find the sample mean of this data (x ě…). 2b. find the sample variance of x. find the variance of x ě…. for (c), (d), and (e), use the appropriate t-distribution 2c. find the 90% confidence interval for the population mean (îľ). 2d. test the hypothesis that îľ is equal to 7 at the 95% confidence level. (should you do a one-tailed or two-tailed test here? ) 2e. what is the approximate p-value of this hypothesis?
Answers: 2
You know the right answer?
Construct a Venn diagram of the probabilities from the teacher's survey. Based on the probabilities,...
Questions
Mathematics, 01.04.2021 06:40
Mathematics, 01.04.2021 06:40
Mathematics, 01.04.2021 06:40

English, 01.04.2021 06:40
Mathematics, 01.04.2021 06:40
English, 01.04.2021 06:40
Mathematics, 01.04.2021 06:40
Mathematics, 01.04.2021 06:40
English, 01.04.2021 06:40


Biology, 01.04.2021 06:40


