
Mathematics, 17.11.2020 08:00 michaelchavez6959127
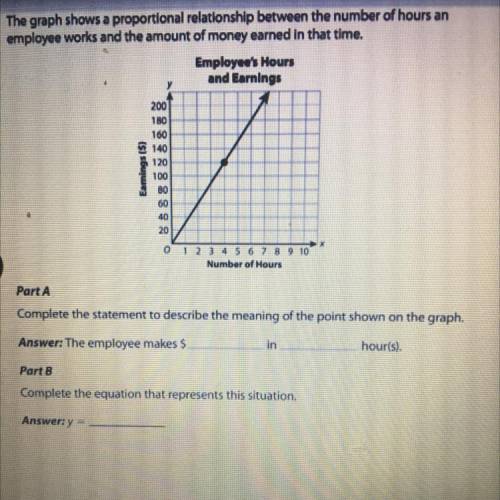
4. The graph shows a proportional relationship between the number of hours an
employee works and the amount of money earned in that time.
Employee's Hours
and Earnings
Eamings ($)
200
1HO
160
140
120
100
80
60
40
20
0 1 2 3 4 5 6 7 8 9 10
Number of Hours
Part A
Complete the statement to describe the meaning of the point shown on the graph.
The employee makes $
in
hour(s).
Part 8
Complete the equation that represents this situation.
y

Answers: 1
Another question on Mathematics
Mathematics, 21.06.2019 17:00
There are 15 plates and each plate is either 7 or 12 inches diameter. which systems of equations do you use to find the number of 7 inch plates, x and 12 inch plates, y
Answers: 1
Mathematics, 21.06.2019 17:30
Kathy spent 5/8 of her money on books and another 1/6 of her money on stationeries.what fraction of kathy’s money was left?
Answers: 2
Mathematics, 21.06.2019 20:00
The diagram shows corresponding lengths in two similar figures. find the area of the smaller figure. a. 14.4 yd2 b. 24 yd2 c. 26.4 yd2 d. 28
Answers: 1
Mathematics, 21.06.2019 23:00
Rob filled 5 fewer plastic boxes with football cards than basketball cards. he filled 11 boxes with basketball cards.
Answers: 1
You know the right answer?
4. The graph shows a proportional relationship between the number of hours an
employee works and th...
Questions


Chemistry, 17.01.2022 14:00
History, 17.01.2022 14:00


Mathematics, 17.01.2022 14:00
History, 17.01.2022 14:00

History, 17.01.2022 14:00

Mathematics, 17.01.2022 14:00


French, 17.01.2022 14:00
Chemistry, 17.01.2022 14:00

Health, 17.01.2022 14:00
Health, 17.01.2022 14:00


