
Mathematics, 18.11.2020 07:30 probablyacommunist
I'm Serena. For a science project, my friend Jack and I are launching three model rockets, one after another. We launch the first rocket, and then 3 seconds later, we launch the next one. And we're launching the final rocket three seconds after that, from a platform that is 20 feet high.
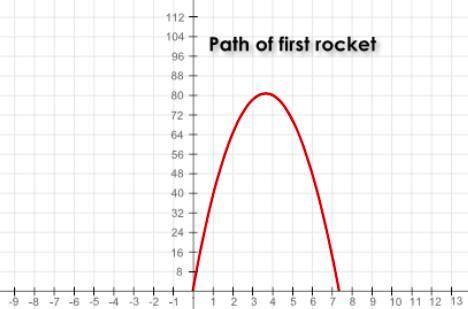
For our project, we need to predict the paths for all three rockets. We also need to estimate when they will all be in the air at the same time. [A graph that shows "Height of rocket (feet)" on the y-axis and "Time (seconds)" on the x-axis is shown. A red downturned parabola is shown and labeled "Path of the first rocket."]
We have calculated the path of the first rocket. It looks like this: a parabola that opens down. The y-axis is the height of the rocket in feet, and the x-axis is the time in seconds.
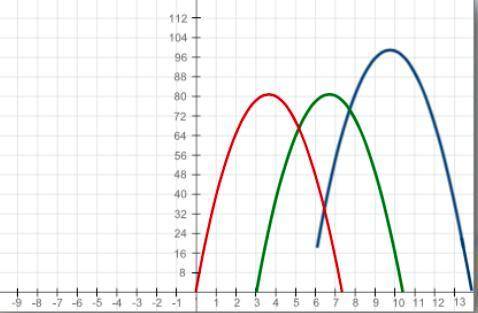
My friend Jack thinks we need to recalculate the graphs for the other two model rockets. But since the rockets are all the same, I think we can just shift the graph of the first rocket to find the graphs for the other two. [The graph is duplicated in green and shifts to the right, and then again in blue and shifts to the right and up. Then the rockets blast off again.]
What do you think? How can we use the graph of the first rocket to create the graphs of the second and third rockets? When will all three rockets be in the air at the same time?Evaluate the Conjectures:
2. Do you agree with Serena that you can draw the graphs for the other two rockets by shifting the functions? Or do you think that Jack is correct that you need to recalculate the other two? Explain. (2 points)
Analyzing the Data:
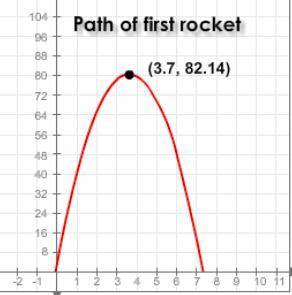
Suppose that the path of the first model rocket follows the equation
h(t) = −6 • (t − 3.7)2 + 82.14,
where t is the time in seconds (after the first rocket is launched), and h(t) is the height of each rocket, in feet.
Compare the equation with the graph of the function. Assume this graph is a transformation from f(t) = –6t2. What does the term –3.7 do to the rocket's graph? What does the value t = 3.7 represent in the science project? (What happens to the rocket?)
Again assuming a transformation from f(t) = –6t2, what does the term 82.14 do to the rocket's graph? What does the value h(t) = 82.14 represent in the science project? (What is happening to the rocket?) (2 points)
Serena and Jack launch the second rocket 3 seconds after the first one. How is the graph of the second rocket different from the graph of the first rocket? Describe in terms of the vertical and horizontal shift.
What is the equation of the second rocket?
They launch the third rocket 3 seconds after the second rocket and from a 20-foot-tall platform. What will the graph of the third rocket look like? Describe in terms of the vertical and horizontal shift.
What is the equation of the third rocket?
Answer the following questions about the three rockets. Refer to the graph of rocket heights and times shown above.
a. Approximately when is the third rocket launched?
b. Approximately when does the first rocket land?
c. What is the approximate interval during which all three rockets are in the air?

Answers: 3
Another question on Mathematics
Mathematics, 21.06.2019 18:00
Which statement about the relative areas of δabc and δxyz is true? the area of δabc > the area of δxyz the area of δabc < the area of δxyz the area of δabc = the area of δxyz more information is needed to compare.
Answers: 2
Mathematics, 22.06.2019 01:00
The price for gasoline is represented by the equation y=3.69x, where y represents the total price for x gallons of gasoline. on a graph, the number of gallons is represented on the horizontal axis, and the total price is represented on the vertical axis. determine whether each statement describes the graph of the equation. select true or false for each statement
Answers: 2
Mathematics, 22.06.2019 01:30
This graph shows a portion of an odd function. use the graph to complete the table of values. x f(x) −2 −3 −4 −6
Answers: 3
Mathematics, 22.06.2019 03:10
Ofof is a ? a. (1, 2), (1,-2), (3, 2), (3, 4) b. (1,6), (2, ,9), (0,5) c. (0, 2), (2,3), (0, -2), (4,1) d. (2, 4), (0, 2), (2, - 4), (5,3)
Answers: 1
You know the right answer?
I'm Serena. For a science project, my friend Jack and I are launching three model rockets, one after...
Questions


Biology, 26.09.2019 01:10


Social Studies, 26.09.2019 01:10
Social Studies, 26.09.2019 01:10
Social Studies, 26.09.2019 01:10
Social Studies, 26.09.2019 01:10
Social Studies, 26.09.2019 01:10
Social Studies, 26.09.2019 01:10
Social Studies, 26.09.2019 01:10

Social Studies, 26.09.2019 01:10
Social Studies, 26.09.2019 01:10
Social Studies, 26.09.2019 01:10
Social Studies, 26.09.2019 01:10


