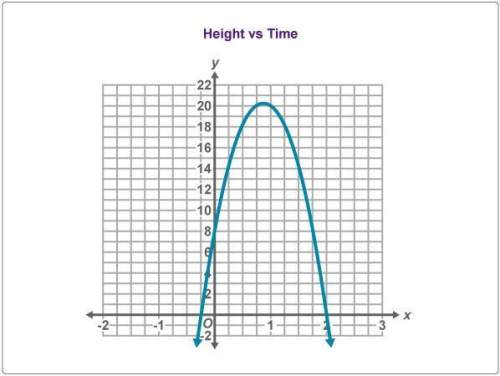
The graph represents the water level of a tank after an inlet pipe is turned on.
y
1
Wa...

Mathematics, 19.11.2020 20:50 Maria3737
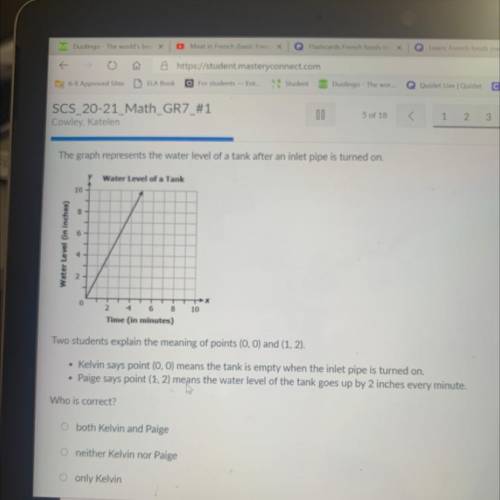
The graph represents the water level of a tank after an inlet pipe is turned on.
y
1
Water Level of a Tank
10
8
6
Water Level (in inches)
X
0
10
2 4 6 8
Time (in minutes)
Two students explain the meaning of points (0,0) and (1,2).
• Kelvin says point (0,0) means the tank is empty when the inlet pipe is turned on.
• Paige says point (1, 2) means the water level of the tank goes up by 2 inches every minute.
Who is correct?
o both Kelvin and Paige
O neither Kelvin nor Paige
O only Kelvin

Answers: 2
Another question on Mathematics
Mathematics, 21.06.2019 15:30
The tiles below are pieces of a normal ecg tracing representing a little less than two heartbeats at a resting rate of 80 bpm. arrange the tiles in their correct order. rank from first to last. do not overlap any tiles.
Answers: 1
Mathematics, 21.06.2019 21:30
Which of the following disjunctions is true? 4 + 4 = 16 or 6 - 5 = 11 4 · 3 = 7 or 3 - 2 = 5 8 - 5 = 13 or 7 · 2 = 12 7 - 4 = 11 or 6 + 3 = 9
Answers: 1
Mathematics, 21.06.2019 22:30
Awoman has 14 different shirts: 10 white shirts and 4 red shirts. if she randomly chooses 2 shirts to take with her on vacation, then what is the probability that she will choose two white shirts? show your answer in fraction and percent, round to the nearest whole percent.
Answers: 1
Mathematics, 22.06.2019 02:30
From a group of 10 men and 8 women, 5 people are to be selected for a committee so that at least 4 men are on the committee. howmany ways can it be done?
Answers: 2
You know the right answer?
Questions

Biology, 24.07.2019 07:00


Social Studies, 24.07.2019 07:00
History, 24.07.2019 07:00
History, 24.07.2019 07:00

Biology, 24.07.2019 07:00
Spanish, 24.07.2019 07:00

Social Studies, 24.07.2019 07:00
Social Studies, 24.07.2019 07:00
Social Studies, 24.07.2019 07:00

Social Studies, 24.07.2019 07:00


