Which situation could this graph represent?
A Running up a hill, then walking up the hill
B D...

Mathematics, 19.11.2020 21:20 RealGibbon857
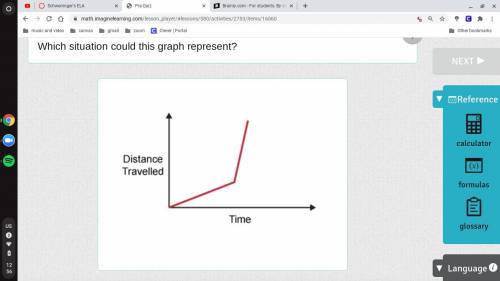
Which situation could this graph represent?
A Running up a hill, then walking up the hill
B Driving a car at the same constant speed.
C Walking down a hill, then running down the hill.
D Driving a car at a fast constant speed, then driving at a slower constant speed.

Answers: 2
Another question on Mathematics
Mathematics, 21.06.2019 22:50
Aclassroom is made up of 11 boys and 14 girls. the teacher has four main classroom responsibilities that she wants to hand out to four different students (one for each of the four students). if the teacher chooses 4 of the students at random, then what is the probability that the four students chosen to complete the responsibilities will be all boys?
Answers: 1
Mathematics, 22.06.2019 00:00
City l has a temperature of −3 °f. city m has a temperature of −7 °f. use the number line shown to answer the questions: number line from negative 8 to positive 8 in increments of 1 is shown. part a: write an inequality to compare the temperatures of the two cities. (3 points) part b: explain what the inequality means in relation to the positions of these numbers on the number line. (4 points) part c: use the number line to explain which city is warmer. (3 points)
Answers: 2
Mathematics, 22.06.2019 00:30
If you eat 4 medium strawberries, you get 48% of your daily recommenced amount of vitamin c. what fraction of your daily amount of vitamin c do you still need?
Answers: 1
Mathematics, 22.06.2019 01:10
Time (minutes) amount of water (gallons) practice 1. jin fills up a 510-gallon pool in the backyard for her children. she fills it with the garden hose at a rate of 17 gallons per minute. after it is filled, she lets it sit for 30 minutes in order to let the water temperature rise. the children then get in and have fun for an hour. the pool loses about 5 gallon of water each minute due to their splashing and playing. at the end of the hour, they tear the pool while getting out, which causes a leak the pool then begins to lose water at a rate of 2 gallons per minute. a. complete the table to show the amount of water in the pool after each minute. b. create a graph to model the problem situation. include when the pool will be empty. c. write a piecewise function that models this problem situation. explain your reasoning for each piece of the function. d. identify the x- and y-intercept. explain what they mean in terms of the problem situation, atamantha a cul 80 100 120 150 200 ning, inc
Answers: 3
You know the right answer?
Questions

Biology, 19.07.2019 18:00


Chemistry, 19.07.2019 18:00

German, 19.07.2019 18:00

Health, 19.07.2019 18:00

Business, 19.07.2019 18:00

Mathematics, 19.07.2019 18:00
History, 19.07.2019 18:00
Mathematics, 19.07.2019 18:00
Mathematics, 19.07.2019 18:00


