Help asap!!
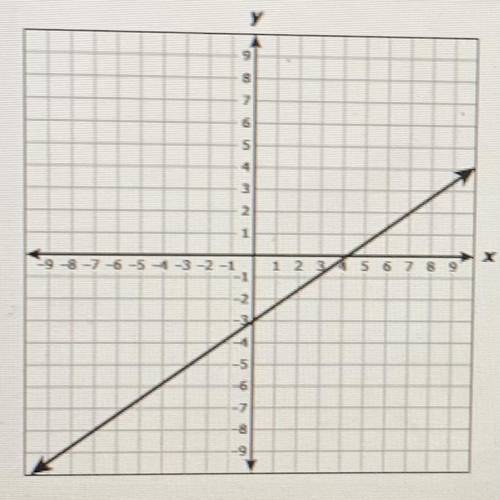
The graph of a linear function is shown on the grid.
Which equation is best...

Mathematics, 20.11.2020 01:20 myaaa13754
Help asap!!
The graph of a linear function is shown on the grid.
Which equation is best renresented by this graph?

Answers: 2
Another question on Mathematics
Mathematics, 21.06.2019 22:50
Aclassroom is made up of 11 boys and 14 girls. the teacher has four main classroom responsibilities that she wants to hand out to four different students (one for each of the four students). if the teacher chooses 4 of the students at random, then what is the probability that the four students chosen to complete the responsibilities will be all boys?
Answers: 1
Mathematics, 21.06.2019 23:40
The bolo cavern outside of vandalia is 421 ft below sea level. a little more than75 miles away. mt owens is 7295 feet above sea level. what is the difference in elevation between the bolo cavern and mt owens?
Answers: 1
Mathematics, 22.06.2019 03:00
Describe how the presence of possible outliers might be identified on the following. (a) histograms gap between the first bar and the rest of bars or between the last bar and the rest of bars large group of bars to the left or right of a gap higher center bar than surrounding bars gap around the center of the histogram higher far left or right bar than surrounding bars (b) dotplots large gap around the center of the data large gap between data on the far left side or the far right side and the rest of the data large groups of data to the left or right of a gap large group of data in the center of the dotplot large group of data on the left or right of the dotplot (c) stem-and-leaf displays several empty stems in the center of the stem-and-leaf display large group of data in stems on one of the far sides of the stem-and-leaf display large group of data near a gap several empty stems after stem including the lowest values or before stem including the highest values large group of data in the center stems (d) box-and-whisker plots data within the fences placed at q1 â’ 1.5(iqr) and at q3 + 1.5(iqr) data beyond the fences placed at q1 â’ 2(iqr) and at q3 + 2(iqr) data within the fences placed at q1 â’ 2(iqr) and at q3 + 2(iqr) data beyond the fences placed at q1 â’ 1.5(iqr) and at q3 + 1.5(iqr) data beyond the fences placed at q1 â’ 1(iqr) and at q3 + 1(iqr)
Answers: 1
Mathematics, 22.06.2019 05:30
The equation of line e is y = -4/9x + 5/6. line f is parallelto line e. what is the slope of line f
Answers: 1
You know the right answer?
Questions


Physics, 27.08.2019 18:30
Mathematics, 27.08.2019 18:30

Biology, 27.08.2019 18:30
Mathematics, 27.08.2019 18:30
Mathematics, 27.08.2019 18:30
Biology, 27.08.2019 18:30

Spanish, 27.08.2019 18:30

English, 27.08.2019 18:30
English, 27.08.2019 18:30
Mathematics, 27.08.2019 18:30
Mathematics, 27.08.2019 18:30
History, 27.08.2019 18:30
Mathematics, 27.08.2019 18:30
History, 27.08.2019 18:30
History, 27.08.2019 18:30


