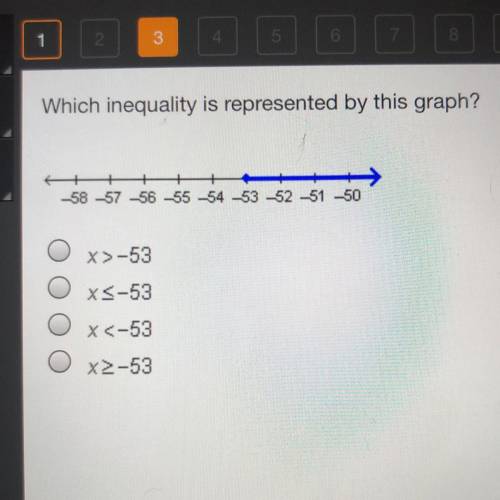
Which inequality is represented by this graph?
+ +
-58 -57 -56 -55 -54 -53 -52 -51 -50
...

Mathematics, 20.11.2020 02:30 janayflowers042
Which inequality is represented by this graph?
+ +
-58 -57 -56 -55 -54 -53 -52 -51 -50
O x>-53
x<-53
O x<-53
O x2-53

Answers: 1
Another question on Mathematics
Mathematics, 21.06.2019 17:40
How can the correlation in the scatter plot graph below best be described? positive correlation negative correlation both positive and negative no correlation
Answers: 1
Mathematics, 21.06.2019 18:40
Offering 30 if a plus b plus c equals 68 and ab plus bc plus ca equals 1121, where a, b, and c are all prime numbers, find the value of abc. the answer is 1978 but i need an explanation on how to get that.
Answers: 3
Mathematics, 21.06.2019 19:30
How long must $542 be invested at a rate of 7% to earn $303.52 in interest? in a easier way
Answers: 1
Mathematics, 21.06.2019 23:50
Which statement explains how you could use coordinate geometry to prove the opposite sides of a quadrilateral are congruent? a. use the slope formula to prove the slopes of the opposite sides are the same. b. use the slope formula to prove the slopes of the opposite sides are opposite reciprocals. c. use the distance formula to prove the lengths of the opposite sides are the same. d. use the distance formula to prove the midpoints of the opposite sides are the same.
Answers: 3
You know the right answer?
Questions

Chemistry, 07.05.2020 05:15


Mathematics, 07.05.2020 05:15

Business, 07.05.2020 05:15


Mathematics, 07.05.2020 05:16


