Consider the graph below.
N
1
-3 -2 -1
1
2
3
4
5
3<...

Mathematics, 25.11.2020 01:40 irlrisottonero
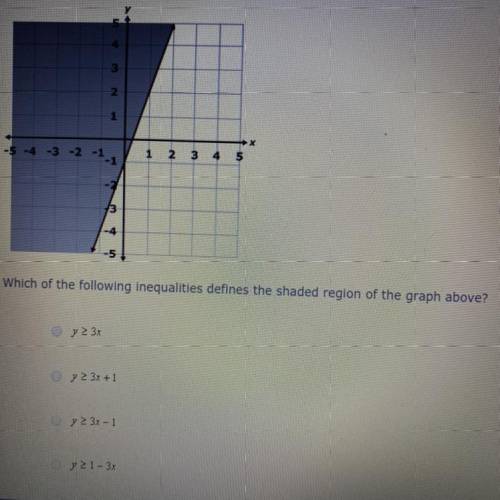
Consider the graph below.
N
1
-3 -2 -1
1
2
3
4
5
3
-4
Which of the following inequalities defines the shaded region of the graph above?
v> 3x
y 2 3x + 1
y 23x - 1
y 21 - 3x

Answers: 3
Another question on Mathematics
Mathematics, 21.06.2019 18:20
What is the y-intercept of the line given by the equation
Answers: 2
Mathematics, 21.06.2019 19:10
1jessica's home town is a mid-sized city experiencing a decline in population. the following graph models the estimated population if the decline continues at the same rate. select the most appropriate unit for the measure of time that the graph represents. a. years b. hours c. days d. weeks
Answers: 2
You know the right answer?
Questions

Arts, 25.07.2019 01:30


History, 25.07.2019 01:30
Mathematics, 25.07.2019 01:30


Chemistry, 25.07.2019 01:30

English, 25.07.2019 01:30

Biology, 25.07.2019 01:30
Biology, 25.07.2019 01:30
Arts, 25.07.2019 01:30
Arts, 25.07.2019 01:30


