
Mathematics, 25.11.2020 14:00 devenaire
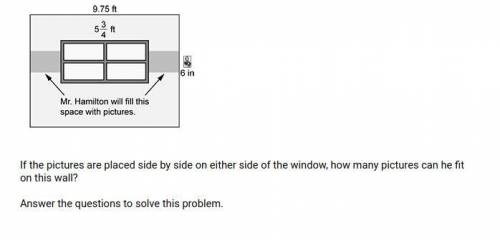
(HELP PLEASE!! answer all the questions) Mr. Smith decorates his U. S. History classroom by putting up pictures of the presidents. The wall is 9.75 feet long. In the center, there is a window that is 5 34feet long.
Each president's picture is 6 inches wide.
If the pictures are placed side by side on either side of the window, how many pictures can he fit on this wall?
Answer the questions to solve this problem.
1. How many feet long is the space Mr. Thuman wants to fill with pictures? Explain how you know.
Write your answer in the space below.
2. Convert this length to inches. (There are 12 inches in 1 foot)
Write your answer in the space below.
3. How many pictures will Mr. Thuman use? Explain how you found your answer.
Write your answer in the space below.
4. How would your answer change if the pictures were 10 inches wide? Explain.
Write your answer in the space below.

Answers: 3
Another question on Mathematics
Mathematics, 21.06.2019 17:50
Find the cosine function that is represented in the graph.
Answers: 1
Mathematics, 21.06.2019 20:30
What is the radius of a circle with an area of 78.5 cubic inches? use 3.14 for pie
Answers: 2
Mathematics, 21.06.2019 23:20
In a small section of a stadium there are 40 spectators watching a game between the cook islands and fiji. they all support at least one of the two teams. 25 spectators support the cook islands and 16 of these support both teams. how many support only fiji?
Answers: 2
Mathematics, 22.06.2019 01:30
Given are five observations for two variables, x and y. xi 1 2 3 4 5 yi 3 7 5 11 14 which of the following is a scatter diagrams accurately represents the data? what does the scatter diagram developed in part (a) indicate about the relationship between the two variables? try to approximate the relationship betwen x and y by drawing a straight line through the data. which of the following is a scatter diagrams accurately represents the data? develop the estimated regression equation by computing the values of b 0 and b 1 using equations (14.6) and (14.7) (to 1 decimal). = + x use the estimated regression equation to predict the value of y when x = 4 (to 1 decimal). =
Answers: 3
You know the right answer?
(HELP PLEASE!! answer all the questions) Mr. Smith decorates his U. S. History classroom by putting...
Questions
Mathematics, 08.01.2022 05:40
Mathematics, 08.01.2022 05:40

Mathematics, 08.01.2022 05:40
Mathematics, 08.01.2022 05:50

Chemistry, 08.01.2022 05:50


Mathematics, 08.01.2022 05:50

Social Studies, 08.01.2022 05:50

Chemistry, 08.01.2022 05:50
Mathematics, 08.01.2022 05:50

Mathematics, 08.01.2022 05:50
Mathematics, 08.01.2022 05:50


