4 + x,

Mathematics, 26.11.2020 22:00 ecarter8967
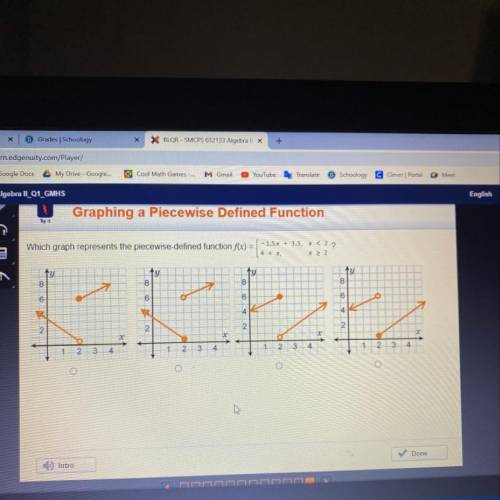
Which graph represents the piecewise-defined function f(x) =
- 1.5x + 3.5, x < 2?
4 + x,
x 22
ty
8
ty
8
ty
8
8
7
6
6
6
4
2
2
2
2
x
*
2
3
4
2
3
4
1
2
3
23
4
o

Answers: 1
Another question on Mathematics
Mathematics, 21.06.2019 15:50
Astandard deck of cards contains 52 cards. one card is selected from the deck. (a) compute the probability of randomly selecting a seven or king. (b) compute the probability of randomly selecting a seven or king or jack. (c) compute the probability of randomly selecting a queen or spade.
Answers: 2
Mathematics, 21.06.2019 23:00
Frank has a devised a formula for his catering business that calculates the number of meatballs he needs to prepare. the formula is m=4a+2c, where c=number of children; m=number of meatballs; a=number of adults. how many meatballs are required for a party of 10 adults and 5 children?
Answers: 1
Mathematics, 22.06.2019 02:30
Which problem would you use the following proportion to solve for? 24/x=40/100 a. what is 40% of 24? b. what percent is 24 of 40? c. twenty-four is 40% of what number? d. forty percent of 24 is what number?
Answers: 3
You know the right answer?
Which graph represents the piecewise-defined function f(x) =
- 1.5x + 3.5, x < 2?
4 + x,
4 + x,
Questions

Mathematics, 29.10.2019 18:31
Mathematics, 29.10.2019 18:31


Spanish, 29.10.2019 18:31
English, 29.10.2019 18:31


