
Mathematics, 28.11.2020 21:50 onna172001
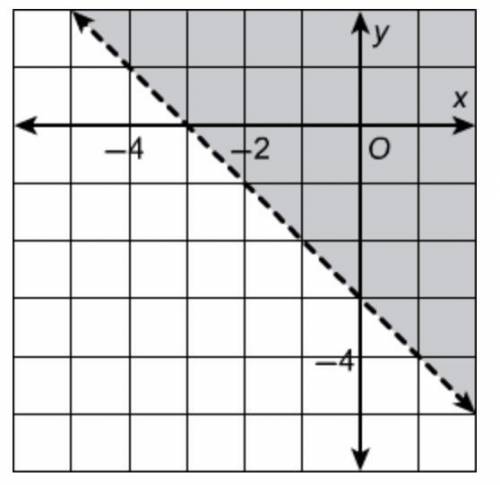
Which inequality does the graph represent?
The graph with X-coordinate marks -4, -2, and 0; Y-coordinate marks -4, -2 and 0. There is a dotted line which intersects x-axis at (-3, 0) and intersects y-axis at the point (0, -3). There is shaded region which above the line.
A. y −x − 3
C. y ≤ −x − 3
D. y ≥ −x − 3

Answers: 2
Another question on Mathematics
Mathematics, 21.06.2019 16:30
Arandom sample of 150 high school students were asked whether they have a job. the results are shown in the table. have a job do not have a job male 48 35 female 41 26 select a ord or phrase from the drop-down menus to correctly complete the statements describing the association.
Answers: 1
Mathematics, 21.06.2019 18:50
Expresa commuter train leaves downtown sation and travels at a average speed of 55 miles per hour towards the north side sation, which is 50miles away. thirty minutes later, express commuter train #7 leaves north side and travels at a average speed of 35miles per hour towards downtown sation. at the moment the two trains pass each other, how far(in miles) is train #12 from the downtown sation and how long(in minutes) has the #12 train been traveling
Answers: 1
Mathematics, 21.06.2019 21:00
Timmy uses 1 1 2 cups of sugar for every 2 gallons of lemonade he makes. how many cups of sugar would timmy use if he makes 13 gallons of lemonade?
Answers: 1
Mathematics, 21.06.2019 23:20
Point r divides in the ratio 1 : 5. if the coordinates of e and f are (4, 8) and (11, 4), respectively, what are the coordinates of r to two decimal places?
Answers: 3
You know the right answer?
Which inequality does the graph represent?
The graph with X-coordinate marks -4, -2, and 0; Y-coo...
Questions


Computers and Technology, 29.02.2020 02:00

Computers and Technology, 29.02.2020 02:00

Mathematics, 29.02.2020 02:00


