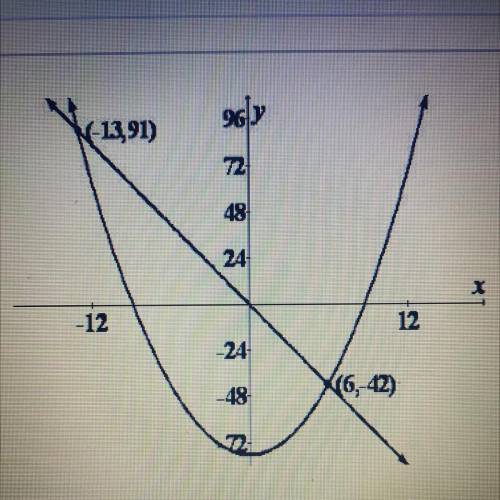
The graph shown can be used to solve which of these systems of equations?
A)
y = -7x and y =...

Mathematics, 04.12.2020 08:40 Legojackson78
The graph shown can be used to solve which of these systems of equations?
A)
y = -7x and y = x - 78
B)
y = -7x and y = x2 - 78
C)
y = 7x and y = x - 78
D)
y = 7x and y = x2 - 78

Answers: 3
Another question on Mathematics
Mathematics, 21.06.2019 18:00
The given dot plot represents the average daily temperatures, in degrees fahrenheit, recorded in a town during the first 15 days of september. if the dot plot is converted to a box plot, the first quartile would be drawn at __ , and the third quartile would be drawn at link to the chart is here
Answers: 1
Mathematics, 21.06.2019 20:00
Which of these tools or constructions is used to inscribe a hexagon inside a circle?
Answers: 1
Mathematics, 21.06.2019 20:00
What are the domain and range of the function f(x)=2^x+1
Answers: 1
You know the right answer?
Questions

Computers and Technology, 18.03.2021 01:50


Arts, 18.03.2021 01:50


English, 18.03.2021 01:50


