
Mathematics, 04.12.2020 18:40 doanh27
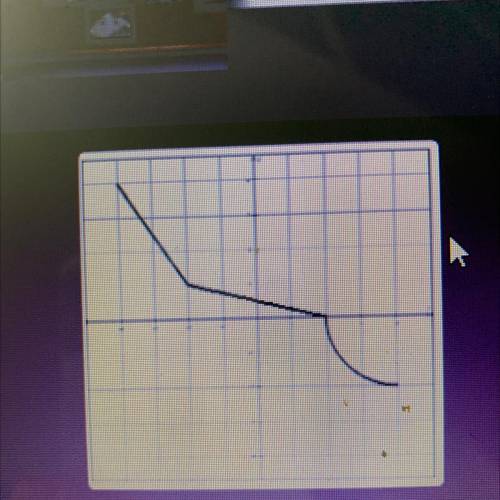
The graph of the function f is given above. Give
the points necessary to draw a complete graph (at
least 4) of g(x) = f (x) - 3

Answers: 3
Another question on Mathematics
Mathematics, 22.06.2019 01:30
Find the circumference of a pizza with a diameter of 10 inches round to the nearest tenth
Answers: 1
Mathematics, 22.06.2019 01:50
Lesson 9-3 for items 8-10, a square is drawn in the coordinate plane, with vertices as shown in the diagram. then the square is reflected across the x-axis. -2 4 8. the function that describes the reflection is (x, y) - a. (x, y-3). b. (x, y-6). c. (-x, y). d. (x,- y).
Answers: 2
Mathematics, 22.06.2019 01:50
Without any equipment, you can see stars that are 2{,}800{,}0002,800,0002, comma, 800, comma, 000 light-years away. by looking through a small telescope, you can see stars that are 3{,}112{,}000{,}0003,112,000,0003, comma, 112, comma, 000, comma, 000 light-years away. approximately how many times as far can you see using a small telescope as without any equipment?
Answers: 3
Mathematics, 22.06.2019 02:30
Atrain traveled for 1.5 hours to the first station, stopped for 30 minutes, then traveled for 4 hours to the final station where it stopped for 1 hour. the total distance traveled is a function of time. which graph most accurately represents this scenario? a graph is shown with the x-axis labeled time (in hours) and the y-axis labeled total distance (in miles). the line begins at the origin and moves upward for 1.5 hours. the line then continues upward at a slow rate until 2 hours. from 2 to 6 hours, the line continues quickly upward. from 6 to 7 hours, it moves downward until it touches the x-axis a graph is shown with the axis labeled time (in hours) and the y axis labeled total distance (in miles). a line is shown beginning at the origin. the line moves upward until 1.5 hours, then is a horizontal line until 2 hours. the line moves quickly upward again until 6 hours, and then is horizontal until 7 hours a graph is shown with the axis labeled time (in hours) and the y-axis labeled total distance (in miles). the line begins at the y-axis where y equals 125. it is horizontal until 1.5 hours, then moves downward until 2 hours where it touches the x-axis. the line moves upward until 6 hours and then moves downward until 7 hours where it touches the x-axis a graph is shown with the axis labeled time (in hours) and the y-axis labeled total distance (in miles). the line begins at y equals 125 and is horizontal for 1.5 hours. the line moves downward until 2 hours, then back up until 5.5 hours. the line is horizontal from 5.5 to 7 hours
Answers: 1
You know the right answer?
The graph of the function f is given above. Give
the points necessary to draw a complete graph (at<...
Questions
Mathematics, 11.02.2021 01:00

Mathematics, 11.02.2021 01:00

Mathematics, 11.02.2021 01:00
Mathematics, 11.02.2021 01:00

Mathematics, 11.02.2021 01:00

Biology, 11.02.2021 01:00

Mathematics, 11.02.2021 01:00
English, 11.02.2021 01:00
Chemistry, 11.02.2021 01:00

Mathematics, 11.02.2021 01:00
Mathematics, 11.02.2021 01:00
Mathematics, 11.02.2021 01:00


