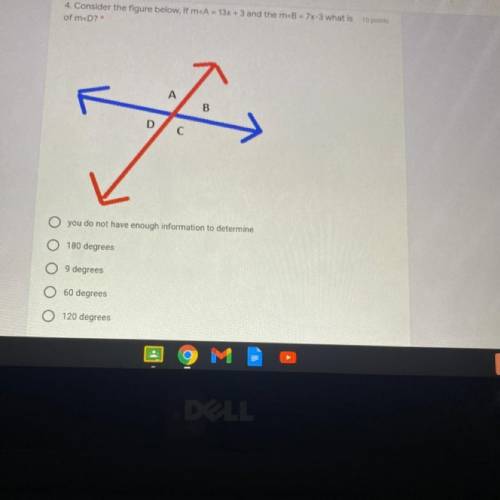
4. Consider the figure below, If m
of m
...

Answers: 1
Another question on Mathematics

Mathematics, 21.06.2019 17:00
One month, a music site observed that 60% of the people who downloaded songs from its site downloaded q sam's latest single. the equation below represents this information, where x represents the total number of people who ddownloaded songs from the site that month: x = 0.6x + 384 how many people who downloaded songs from the site that month downloaded q sam's latest single?
Answers: 3
Mathematics, 22.06.2019 01:20
The first week samantha learned to read braille, she could read 10 words per minute. in the second week she increased her speed by 20%. in the third week she increased her speed again by another 25%. how many words could she read per minute by the third week? hurry and tell me!
Answers: 1
Mathematics, 22.06.2019 01:30
Asample of 200 rom computer chips was selected on each of 30 consecutive days, and the number of nonconforming chips on each day was as follows: the data has been given so that it can be copied into r as a vector. non.conforming = c(10, 15, 21, 19, 34, 16, 5, 24, 8, 21, 32, 14, 14, 19, 18, 20, 12, 23, 10, 19, 20, 18, 13, 26, 33, 14, 12, 21, 12, 27) #construct a p chart by using the following code. you will need to enter your values for pbar, lcl and ucl. pbar = lcl = ucl = plot(non.conforming/200, ylim = c(0,.5)) abline(h = pbar, lty = 2) abline(h = lcl, lty = 3) abline(h = ucl, lty = 3)
Answers: 3
Mathematics, 22.06.2019 03:50
Amovie producer conducted a survey after the screening of his movie to find out how the film would be received by viewers from different age groups. the columns in the two-way table indicate the numbers of viewers who rated the film on a four-point scale: excellent, good, average, and poor. viewer's age group excellent good average poor marginal totals 16-25 52 42 12 7 113 26-35 33 50 5 9 97 36-45 58 12 28 34 132 which of these observations is supported by the data in the table? note: a rating of good or excellent means the audience liked the movie, while a rating of poor means the audience disliked the movie. a. the majority of the audience in the 26-35 age group disliked the movie. b. among those who liked the movie, the majority were in the oldest age group. c. among those who disliked the movie, the majority were in the 26-35 age group. d. the majority of the audience in the 16-25 age group liked the movie. e. the majority of the audience from all the age groups disliked the movie
Answers: 3
You know the right answer?
Questions

History, 20.01.2021 03:10
History, 20.01.2021 03:10

Biology, 20.01.2021 03:10

English, 20.01.2021 03:10
History, 20.01.2021 03:10

Chemistry, 20.01.2021 03:10

Physics, 20.01.2021 03:10

Social Studies, 20.01.2021 03:10
Chemistry, 20.01.2021 03:10
Chemistry, 20.01.2021 03:10
English, 20.01.2021 03:10
History, 20.01.2021 03:10


