
Mathematics, 10.12.2020 03:40 sfmartori
What system of inequalities is shown in the graph?
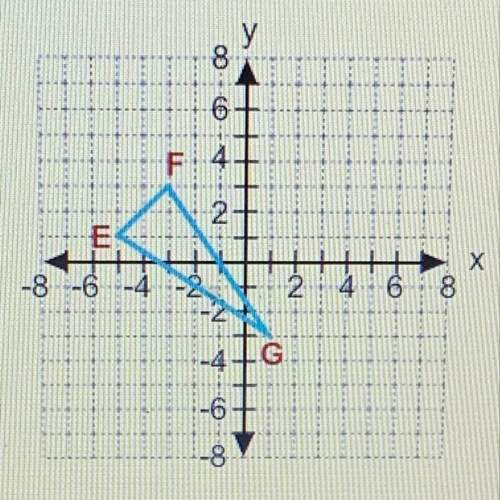
The graph with X-coordinate marks 0, 2, and 4; Y-coordinate marks -2, 0, and 2. There are two lines which intersects each other at point (-1, 2.5). The first line intersects the x-axis at the point (5, 0) and intersects the y-axis at the point (0, 2). There is shaded region which is below the first line. The second line is vertical line which intersects the x-axis at the point (-1, 0). There is shaded region which to the left of the second line.
A. x 2x + 3
B. x 3x + 2
C. x ≤ −1 and y ≤ −0.4x + 2
D. x ≤ −1 and y ≤ −2x + 2

Answers: 1
Another question on Mathematics
Mathematics, 21.06.2019 15:00
Factor completely. 4p^2 + 36p + 81 express the answer in the form (ap + b)^2
Answers: 3
Mathematics, 21.06.2019 23:00
If i purchase a product for $79.99 and two accessories for 9.99 and 7.00 how much will i owe after taxes applies 8.75%
Answers: 2
Mathematics, 22.06.2019 00:20
When steve woke up. his temperature was 102 degrees f. two hours later it was 3 degrees lower. what was his temperature then?
Answers: 3
Mathematics, 22.06.2019 02:00
Reading tests are compared for two students. sara got 98, 100, 65, 78, 98, 46, 100, 100, 45, and 50 on her reading test. lee got 97, 67, 89, 99, 100, 45, 79, 89, 58, and 67 on his reading test.
Answers: 1
You know the right answer?
What system of inequalities is shown in the graph?
The graph with X-coordinate marks 0, 2, and 4; Y...
Questions
Mathematics, 08.12.2021 08:40


Chemistry, 08.12.2021 08:40
Mathematics, 08.12.2021 08:40


Physics, 08.12.2021 08:40

Computers and Technology, 08.12.2021 08:40
Physics, 08.12.2021 08:40

History, 08.12.2021 08:40

Social Studies, 08.12.2021 08:40
Chemistry, 08.12.2021 08:40

Mathematics, 08.12.2021 08:40
Mathematics, 08.12.2021 08:40
Social Studies, 08.12.2021 08:40


