
Mathematics, 11.12.2020 06:00 arlabbe0606
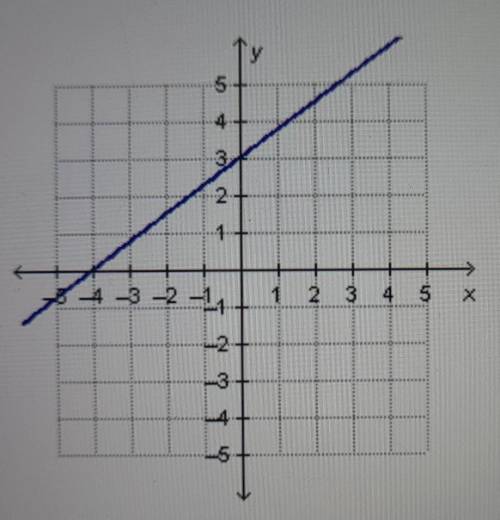
Which linear function has the same y-intercept as the one that is represented by the graph?
y= 2x - 4
y= 2x - 3
y= 2x + 3
y= 2x + 4

Answers: 1
Another question on Mathematics
Mathematics, 21.06.2019 20:30
East black horse $0.25 total budget is $555 it'll cost $115 for other supplies about how many flyers do you think we can buy
Answers: 1
Mathematics, 22.06.2019 00:00
Which of the following would be a correct step in proving that triangle abc is congruent to triangle cda? a. use a protractor to measure the angles and show that all the corresponding angles are equal in measure. this will allow you to prove congruence by aaa. b. show that segment ab is parallel to segment cd and segment ad is parallel to segment cb. this will allow you to prove congruency by asa. c. show that is segment ab is perpendicular to segment ad. this will allow you to prove congruence by sas. d. none of the above.
Answers: 2
Mathematics, 22.06.2019 00:10
Me i need ! find the asymptote and determine the end behavior of the function from the graph. the asymptote of the function is= blank 1 . for very high x-values,y =blank 2 options for blank 1 x=2 x=-2 x=3 x=-3 blank 2 options moves towards negative infinity moves toward the horizontal asymptote moves toward the vertical asymptote moves toward positive infinity
Answers: 1
Mathematics, 22.06.2019 02:30
According to a research study, parents with young children slept 6.4 hours each night last year, on average. a random sample of 18 parents with young children was surveyed and the mean amount of time per night each parent slept was 6.8. this data has a sample standard deviation of 0.9. (assume that the scores are normally distributed.) researchers conduct a one-mean hypothesis at the 5% significance level, to test if the mean amount of time parents with young children sleep per night is greater than the mean amount of time last year. the null and alternative hypotheses are h0: μ=6.4 and ha: μ> 6.4, which is a right-tailed test. the test statistic is determined to be t0=1.89 using the partial t-table below, determine the critical value(s). if there is only one critical value, leave the second answer box blank.
Answers: 3
You know the right answer?
Which linear function has the same y-intercept as the one that is represented by the graph?
y= 2x -...
Questions


Biology, 18.09.2019 15:00


Geography, 18.09.2019 15:00
English, 18.09.2019 15:00
English, 18.09.2019 15:00
Mathematics, 18.09.2019 15:00

Chemistry, 18.09.2019 15:00

Computers and Technology, 18.09.2019 15:00
History, 18.09.2019 15:00
Mathematics, 18.09.2019 15:00

Social Studies, 18.09.2019 15:00
Chemistry, 18.09.2019 15:00
Biology, 18.09.2019 15:00


