
Mathematics, 14.12.2020 18:00 reeseleprell7655
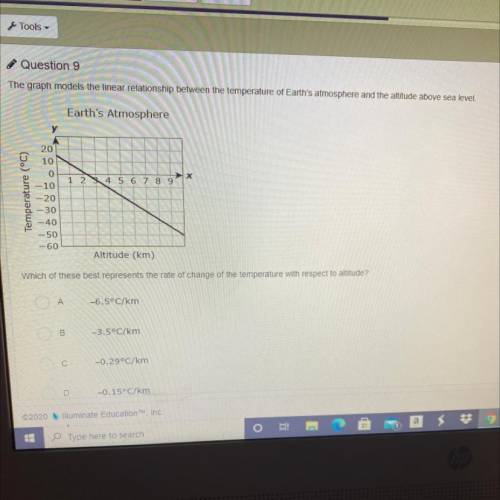
The graph models the linear relationship between the temperature of Earth's atmosphere and the altitude above sea level.
Earth's Atmosphere
y
1
2
4 5 6 7 8 9
Temperature
(°C)
20
10
O
-10
-20
-30
-40
-50
-60
Altitude (km)
Which of these best represents the rate of change of the temperature with respect to altitude
A-6.5°C/km
B- 3.5°C/km
C-0.29°C/km
D-0.15°C/km

Answers: 1
Another question on Mathematics
Mathematics, 21.06.2019 14:00
Assume that a population of 50 individuals has the following numbers of genotypes for a gene with two alleles, b and b: bb = 30, bb = 10, and bb = 10. calculate the frequencies of the two alleles in the population’s gene pool.
Answers: 2
Mathematics, 21.06.2019 15:30
Is each relation a function? if so, state whether it is one-to-one or many-to-one. 3. (-4,7), (-3,5), (1,4), (3,-8), (5,-11) 4. (-4,8), (-2,4), (0,1), (2,4), (4,8) 5. (-2, 1), (-2,3), (0,-3), (1,4), (3,1)
Answers: 3
Mathematics, 21.06.2019 19:50
Asequence is defined recursively using the formula f(n + 1) =f(n) - 5. which sequence could be
Answers: 1
You know the right answer?
The graph models the linear relationship between the temperature of Earth's atmosphere and the altit...
Questions
Mathematics, 15.12.2020 14:00

Mathematics, 15.12.2020 14:00

Chemistry, 15.12.2020 14:00
Mathematics, 15.12.2020 14:00

Biology, 15.12.2020 14:00
Biology, 15.12.2020 14:00

English, 15.12.2020 14:00
Mathematics, 15.12.2020 14:00

History, 15.12.2020 14:00

Mathematics, 15.12.2020 14:00


