
Mathematics, 16.12.2020 01:50 msdsh03
Quick please help
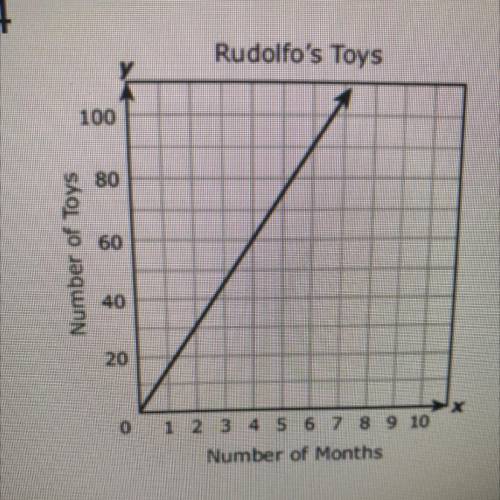
The graph below represents the number of toys Rudolfo has in his toy box after x number of
months. Which equation below best represents this graph?
A. Y=15x
B. Y=30x
C. Y= 1/15x
d. y = 10x

Answers: 1
Another question on Mathematics
Mathematics, 21.06.2019 17:00
The ratio of rock songs to dance songs on jonathan’s mp3 player is 5: 6. the total number of rock and dance songs jonathan has is between 101 120. how many rock songs does he have?
Answers: 2
Mathematics, 22.06.2019 02:50
Given: x - 4x > 0, then the solution set in interval notation is: (-2, 0) true o false
Answers: 1
You know the right answer?
Quick please help
The graph below represents the number of toys Rudolfo has in his toy box after x...
Questions
Mathematics, 20.04.2021 18:40

Chemistry, 20.04.2021 18:40


English, 20.04.2021 18:40


Mathematics, 20.04.2021 18:40
Mathematics, 20.04.2021 18:40
History, 20.04.2021 18:40
Chemistry, 20.04.2021 18:40
Mathematics, 20.04.2021 18:40
Mathematics, 20.04.2021 18:40
Mathematics, 20.04.2021 18:40
English, 20.04.2021 18:40

Mathematics, 20.04.2021 18:40
Mathematics, 20.04.2021 18:40


