
Mathematics, 19.12.2020 07:00 tessalopezgarcia2345
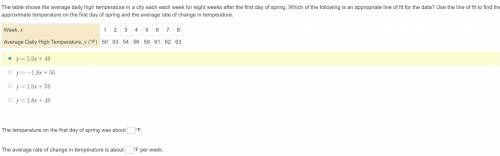
The table shows the average daily high temperature in a city each week for eight weeks after the first day of spring. Which of the following is an appropriate line of fit for the data? Use the line of fit to find the approximate temperature on the first day of spring and the average rate of change in temperature. (Pls help I need it quickly. Thanks!)

Answers: 3
Another question on Mathematics
Mathematics, 21.06.2019 18:30
The bake stars picked 907 apples last weekend at a local orchard they made caramel apples and sold them in the bakery in trays of 6
Answers: 1
Mathematics, 21.06.2019 19:40
It appears that people who are mildly obese are less active than leaner people. one study looked at the average number of minutes per day that people spend standing or walking. among mildly obese people, the mean number of minutes of daily activity (standing or walking) is approximately normally distributed with mean 376 minutes and standard deviation 64 minutes. the mean number of minutes of daily activity for lean people is approximately normally distributed with mean 528 minutes and standard deviation 107 minutes. a researcher records the minutes of activity for an srs of 7 mildly obese people and an srs of 7 lean people. use z-scores rounded to two decimal places to answer the following: what is the probability (image for it appears that people who are mildly obese are less active than leaner people. one study looked at the averag0.0001) that the mean number of minutes of daily activity of the 6 mildly obese people exceeds 420 minutes? what is the probability (image for it appears that people who are mildly obese are less active than leaner people. one study looked at the averag0.0001) that the mean number of minutes of daily activity of the 6 lean people exceeds 420 minutes?
Answers: 1
Mathematics, 21.06.2019 22:20
The school track has eight lanes. each lane is 1.25 meters wide. the arc at each end of the track is 180. the distance of the home straight and the radii for the arcs in the 1st 4 lanes are given. s=85m r1=36.5m r2=37.75m r3=39m r4=40.25m part one: find the radii of lanes 5 through 8 of the track. show your work. part two: if max ran around lane one, how far did he run? show your work and explain your solution. part three: max wants to run a total of three laps around the track, choose two additional lanes (2-8) for him to run and find the distance around those two lanes. show your work and round to the hundredths. part 4: based on your lane choices in part three, what was the total distance max ran in the three laps around the track?
Answers: 2
You know the right answer?
The table shows the average daily high temperature in a city each week for eight weeks after the fir...
Questions


History, 04.08.2019 15:00
Mathematics, 04.08.2019 15:00
History, 04.08.2019 15:00

English, 04.08.2019 15:00
Mathematics, 04.08.2019 15:00
Mathematics, 04.08.2019 15:00
Mathematics, 04.08.2019 15:00
History, 04.08.2019 15:00
Biology, 04.08.2019 15:00

Social Studies, 04.08.2019 15:00
History, 04.08.2019 15:00
Mathematics, 04.08.2019 15:00


