
Mathematics, 20.12.2020 22:00 jayp02
 Please create a graph to reflect the following situation:
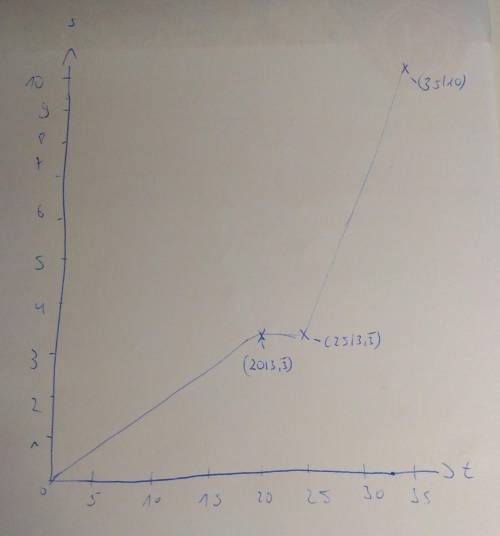
Max is going to school. For the first 20 minutes he walks at a constant speed of 10 miles per hour. Then he gets to the bus stop and waits for the bus for another 5 minutes. Then he rides the bus for 10 minutes. The speed of the bus is 40 miles per hour.
Show graphically the distance Max has traveled to school over time since he has left his house.
Make sure you include the name of the graph, the labels and the scale on x- and y-axes; Please use graphing paper, pencil and a ruler. Please help me it’s due today I would love the help.

Answers: 3

Another question on Mathematics
Mathematics, 21.06.2019 16:00
Ernest is purchasing a $175,000 home with a 30-year mortgage. he will make a $15,000 down payment. use the table below to find his monthly pmi payment.
Answers: 2
Mathematics, 21.06.2019 19:30
At the beginning of 1974/75,2 years a man invested #2000 in a bank at 12.5% compound interest, if it degree #650 at the end of each two years to pay his son's school fees, after payment of interest to pay his son's school fees, how much did he have left at the beginning of the 1978/79 school year?
Answers: 3
You know the right answer?
 Please create a graph to reflect the following situation:
Max is going to school. For the first 2...
Questions

English, 12.11.2020 14:00

Mathematics, 12.11.2020 14:00

Computers and Technology, 12.11.2020 14:00

English, 12.11.2020 14:00

Advanced Placement (AP), 12.11.2020 14:00


History, 12.11.2020 14:00
History, 12.11.2020 14:00

Geography, 12.11.2020 14:00
Mathematics, 12.11.2020 14:00


