
Mathematics, 04.01.2021 06:30 russianspartan1
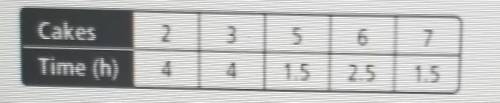
Each day at the bakery, Jack bakes vakes and helps out at the counter. Make a scatter plot of the hours Jake spends at the counter as a function of the number of cakes he bakes. Draw the trend line and chose what the y-intercept of the line represents. Answer the type of correlation the scatter plot shows.
A. average time it takes to bake one cake
B. average number of cakes per hour Jack can bake
C. total time spent baking cakes D. total number of hours Jack works each day
D. total number of hours Jack work each day

Answers: 1
Another question on Mathematics
Mathematics, 21.06.2019 16:20
What are the soultion(s) to the quadratic equation 40- x^2=0
Answers: 1
Mathematics, 22.06.2019 03:30
If the function m(x) has the point (5,2) on its graph name a point that would be on the funtion m(5x)
Answers: 2
You know the right answer?
Each day at the bakery, Jack bakes vakes and helps out at the counter. Make a scatter plot of the ho...
Questions

Health, 19.11.2020 20:30
Health, 19.11.2020 20:30

Mathematics, 19.11.2020 20:30

History, 19.11.2020 20:30
Mathematics, 19.11.2020 20:30

German, 19.11.2020 20:30

Mathematics, 19.11.2020 20:30
Mathematics, 19.11.2020 20:30
Mathematics, 19.11.2020 20:30

English, 19.11.2020 20:30
Mathematics, 19.11.2020 20:30

Arts, 19.11.2020 20:30


