
Mathematics, 05.01.2021 06:00 lovexoxdivap0ifhi
WHOEVER GETS IT CORRECT GETS BRAINLIEST
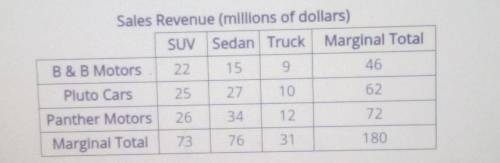
The table shows the annual sales revenue for different types of automobiles from three automobile manufacturers.
(see photo presented)
The company with the highest percentage of sales revenue from sedans is [blank]. Of the annual sales revenue from SUV's, the relative frequency of Pluto Cars is [blank].
Blank #1:
Pluto Cars
B & B Motors
Panther Motors
Blank #2:
0.47
0.34
0.43
(this is a PLATO/Edmentum question.)

Answers: 3
Another question on Mathematics
Mathematics, 21.06.2019 22:40
Adeli owner keeps track of the to-go orders each day. the results from last saturday are shown in the given two-way frequency table. saturday's to-go deli orders in person by phone online total pick up 38 25 31 94 delivery 35 28 34 97 total 73 53 65 191 what percent of the to-go orders were delivery orders placed by phone? a. 14.66% b. 38.41% c. 28.87% d. 52.83%
Answers: 2
Mathematics, 22.06.2019 03:30
Bradley and kelly are out flying kites at a park one afternoon. a model of bradley and kelly's kites are shown below on the coordinate plane as kites brad and kely, respectively: kites adbr and kely are shown on a coordinate plane. the vertices of adbr are a is at 9, 1; d is at 1, 5; b is at 9, 9; and r i which statement is correct about the two kites? (1 point) they are similar because segment br to segment db is 1: 2 and segment ke to segment yk 1: 2. they are not similar because segment br to segment db is 1: 5 and segment ke to segment yk is 1: 2. correct! they are not similar because segment br to segment db is 1: 2 and segment ke to segment yk is 1: 5. they are similar because segment br to segment db is 1: 5 and segment ke to segment yk is 1: 5.
Answers: 1
Mathematics, 22.06.2019 04:10
You are in charge of the customer service phone line with many employees. at the end of each phone callthe customers are asked to rate their service from 1 to 5 stars, with 5 being the best. you find the averagerating for 20 randomly selected employees and decide you want to improve the ratings so you require thoseemployees to go through a new training program. you then wait a week and find the new average rating foreach employee. the average change is an increase in 1.3 stars with a standard devation of .9 stars.(a) is this data paired or not paired? (b) what are the null and alternative hypothesis being tested? (c) what is the t-statistic you would use? write the general formula and the final calculation.(d) sketch a t-distribution, label your t-statistic and the probability you would be interested in:
Answers: 2
Mathematics, 22.06.2019 05:00
He factorization of 8x3 – 125 is (2x – 5)(jx2 + kx + 25). what are the values of j and k?
Answers: 1
You know the right answer?
WHOEVER GETS IT CORRECT GETS BRAINLIEST
The table shows the annual sales revenue for different type...
Questions


Computers and Technology, 26.05.2020 05:58
Mathematics, 26.05.2020 05:58
Mathematics, 26.05.2020 05:58

History, 26.05.2020 05:58
Mathematics, 26.05.2020 05:58
Mathematics, 26.05.2020 05:58


