Zoom in
Linear Regression
Instructions:
Create a scatter plot, find the linear regressi...

Mathematics, 06.01.2021 17:50 ivetter5333
Zoom in
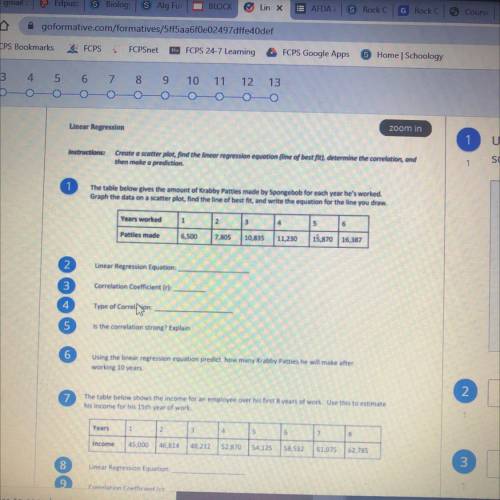
Linear Regression
Instructions:
Create a scatter plot, find the linear regression equation fline of best fit), determine the correlation, and
then make a prediction
The table below gives the amount of Krabby Patties made by Spongebob for each year he's worked.
Graph the data on a scatter plot, find the line of best fit, and write the equation for the line you draw.

Answers: 3
Another question on Mathematics
Mathematics, 21.06.2019 19:10
Which ordered pair is a solution of the equation? y + 5 = 2(2+1) choose 1 answer ® only (5,10 ® only (-1,-5) © both (5, 10) and (-1,-5) 0 neither
Answers: 1
Mathematics, 21.06.2019 19:30
Jada has a meal in a restaurant she adds up the prices listed on the menu for everything they ordered and gets a subtotal of $42.00. after tax the total is 45.99. what percentage of the subtotal is the total?
Answers: 2
Mathematics, 21.06.2019 22:30
I’ve been trying all day to figure this puzzle out. i need the work for it aswell. it is a factoring polynomials tarsia. the image is below.
Answers: 3
Mathematics, 22.06.2019 02:40
Which of the following values have 3 significant figures? check all that apply. a. 10.1 b. 100.05 c. 120 d. 129
Answers: 1
You know the right answer?
Questions

Biology, 20.12.2019 20:31

Computers and Technology, 20.12.2019 20:31
Mathematics, 20.12.2019 20:31
Mathematics, 20.12.2019 20:31
Mathematics, 20.12.2019 20:31

Mathematics, 20.12.2019 20:31

Mathematics, 20.12.2019 20:31
Mathematics, 20.12.2019 20:31
Mathematics, 20.12.2019 20:31
English, 20.12.2019 20:31
History, 20.12.2019 20:31


