
Mathematics, 08.01.2021 01:50 rodriguezjeslin086
Click an item in the list or group of pictures at the bottom of the problem and, holding the button down, drag it into the correct position in the answer box. Release your mouse button when the item is place. If you change your mind, drag the item to the trashcan. Click the trashcan to clear all your answers.
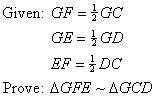
Complete the proof.
Below is a drag and drop geometric proof. Complete the proof in your notebook.

Answers: 2
Another question on Mathematics
Mathematics, 21.06.2019 22:20
Which of the following equations are equivalent to -2m - 5m - 8 = 3 + (-7) + m? -15m = -4m -7m - 8 = m - 4 -3m - 8 = 4 - m m - 4 = -7m - 8 -8 - 7m = -4 + m -8 - 3m = 4 - m
Answers: 1
Mathematics, 22.06.2019 00:30
(c) a vine called the mile-a-minute weed is known for growing at a very fast rate. it can grow up to 0.5 ft per day. how fast in inches per hour can the mile-a-minute weed grow up to? show your work using the correct conversion factors.
Answers: 1
Mathematics, 22.06.2019 02:40
Arestaurant manager wanted to get a better understanding of the tips her employees earn, so she decided to record the number of patrons her restaurant receives over the course of a week, as well as how many of those patrons left tips of at least 15%. the data she collected is in the table below. day mon tue wed thu fri sat sun patrons 126 106 103 126 153 165 137 tippers 82 87 93 68 91 83 64 which day of the week has the lowest experimental probability of patrons tipping at least 15%? a. sunday b. saturday c. friday d. thursday
Answers: 1
Mathematics, 22.06.2019 07:00
The table and the graph each show a different relationship between the same two variables, x and y: a table with two columns and 5 rows is shown. the column head for the left column is x, and the column head for the right column is y. the row entries in the table are 3,240 and 4,320 and 5,400 and 6,480. on the right of this table is a graph. the x-axis values are from 0 to 10 in increments of 2 for each grid line. the y-axis values on the graph are from 0 to 350 in increments of 70 for each grid line. a line passing through the ordered pairs 2, 70 and 4, 140 and 6, 210 and 8, 280 is drawn. how much more would the value of y be in the table, than its value on the graph, when x = 11?
Answers: 2
You know the right answer?
Click an item in the list or group of pictures at the bottom of the problem and, holding the button...
Questions


Business, 12.12.2020 16:10
Mathematics, 12.12.2020 16:10

English, 12.12.2020 16:10

Biology, 12.12.2020 16:10

Mathematics, 12.12.2020 16:10
Biology, 12.12.2020 16:10
Mathematics, 12.12.2020 16:10
Mathematics, 12.12.2020 16:10
Mathematics, 12.12.2020 16:10
Mathematics, 12.12.2020 16:10
Mathematics, 12.12.2020 16:10


