
Mathematics, 11.01.2021 07:40 hidagiser
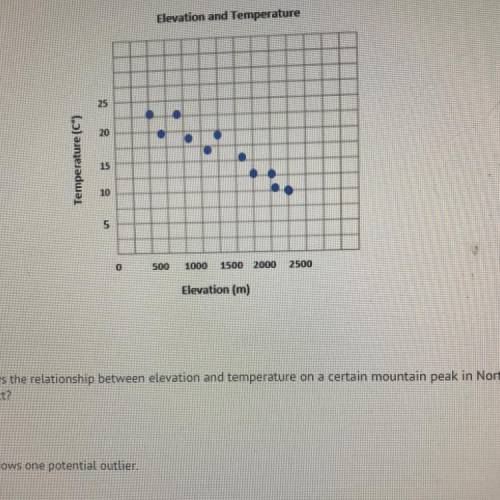
The scatter plot shows the relationship between elevation and temperature on a certain mountain peak in North America. Which
statements are correct?
A)
The data shows one potential outlier.
B)
The data shows a linear association.
C)
The data shows a clustering pattern.
D)
The data shows a negative association.
E)
As elevation increases, temperature decreases.

Answers: 2

Another question on Mathematics
Mathematics, 21.06.2019 18:00
Stephen thublin invests $1,000,000 in a 45-day certificate of deposit with 6.55% interest. what is the total interest income from the investment?
Answers: 1
You know the right answer?
The scatter plot shows the relationship between elevation and temperature on a certain mountain peak...
Questions


History, 05.06.2020 19:01

English, 05.06.2020 19:01
Mathematics, 05.06.2020 19:01
Biology, 05.06.2020 19:01

Mathematics, 05.06.2020 19:01

Computers and Technology, 05.06.2020 19:01

Chemistry, 05.06.2020 19:01
Mathematics, 05.06.2020 19:01

English, 05.06.2020 19:01


