
Mathematics, 13.01.2021 19:20 luis9527
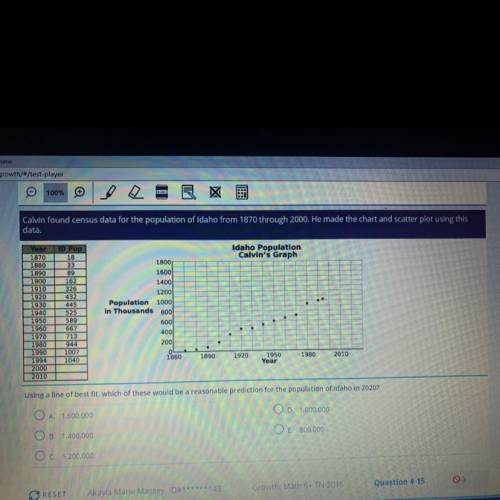
Calvin found census data for the population of Idaho from 1870 through 2000. He made the chart and scatter plot using this
data.
Idaho Population
Calvin's Graph
1800
Year
1870
1880
1890
1900
1910
1920
1930
1940
1950
1960
1970
1980
1990
1994
2000
2010
ID Pop
18
33
89
162
326
432
445
525
589
667
713
944
1007
1040
1600
1400
1200
Population 1000
in Thousands 800
600
400
200
0
1860
1890
1920
1950
Year
1980.
2010
Using a line of best fit, which of these would be a reasonable prediction for the population of Idaho in 2020?
O A. 1.600.000
OD. 1,000,000
OB. 1,400.000
O E. 800,000
O c. 1.200.000

Answers: 1

Another question on Mathematics
Mathematics, 22.06.2019 00:00
Which of the following is the maximum value of the equation y=-x^2+2x+5 a. 5 b. 6 c. 2. d. 1
Answers: 1
Mathematics, 22.06.2019 00:00
A6 ounce bottle of dressing costs $1.56 a 14 ounce bottle costs $3.36 a 20 ounce bottle costs $5.60 which has the lowest cost per ounce
Answers: 1
You know the right answer?
Calvin found census data for the population of Idaho from 1870 through 2000. He made the chart and s...
Questions


Chemistry, 16.03.2022 01:00
SAT, 16.03.2022 01:00

Social Studies, 16.03.2022 01:00
History, 16.03.2022 01:00
Social Studies, 16.03.2022 01:00


