
Mathematics, 14.01.2021 02:10 rakanmadi87
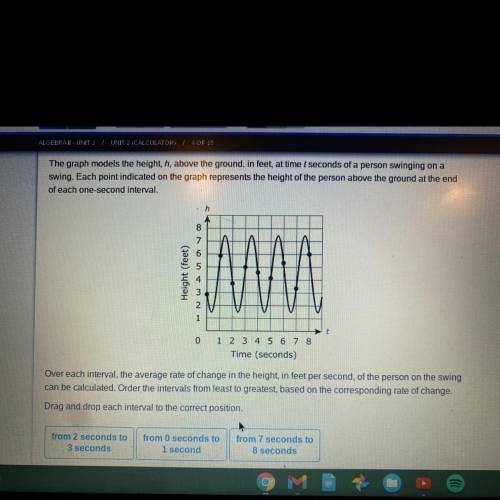
The graph models the height, h, above the ground, in feet, at time t seconds of a person swinging on a
swing. Each point indicated on the graph represents the height of the person above the ground at the end
of each one-second interval.
8
Height (feet)
NWAV
1
0
1 2 3 4 5 6 7 8
Time (seconds)
Over each interval, the average rate of change in the height, in feet per second, of the person on the swing
can be calculated. Order the intervals from least to greatest, based on the corresponding rate of change.
Drag and drop each interval to the correct position.

Answers: 2
Another question on Mathematics
Mathematics, 21.06.2019 14:40
Asequence is defined recursively by the formula f(n + 1) = f(n) + 3 . the first term of the sequence is –4. what is the next term in the sequence? –7–117
Answers: 1
Mathematics, 21.06.2019 18:30
If you are trying to move an attached term across the equal sign (=), what operation would you use to move it?
Answers: 2
Mathematics, 21.06.2019 19:20
Which number completes the system of linear inequalities represented by the graph? y> 2x – 2 and x + 4y 2 et 2 3 4
Answers: 3
Mathematics, 22.06.2019 00:30
Consider this expression and the steps to evaluate it. 4^5(−2)^9/4^8(−2)^3 1. apply the quotient of powers: (−2)^a/4^b 2. evaluate powers: c/d select the value of each variable. a = _ b = _ c = _ d = _
Answers: 3
You know the right answer?
The graph models the height, h, above the ground, in feet, at time t seconds of a person swinging on...
Questions

Physics, 21.05.2021 20:10


Mathematics, 21.05.2021 20:10
Mathematics, 21.05.2021 20:10


Mathematics, 21.05.2021 20:10
Chemistry, 21.05.2021 20:10
Physics, 21.05.2021 20:10
Mathematics, 21.05.2021 20:10
History, 21.05.2021 20:10


