
Mathematics, 20.01.2021 21:20 rex1578
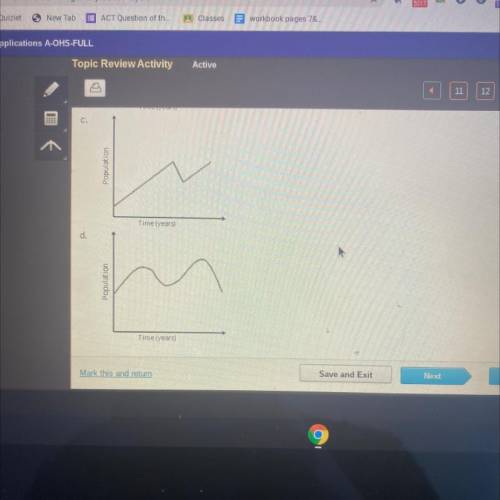
The population of fish in a pond in relation to the number of years since stocking is depicted on a graph. For the first few
years after the pond is stocked, the population grows slowly. It increases more quickly as the fish reproduce, then it
levels off. A pollutant kills off almost all of the fish 20 years after stocking. The population begins to grow again when the
remaining fish reproduce. Which graph depicts the situation described above?
а.
Population
Timely ears)
b.
opulation

Answers: 2
Another question on Mathematics
Mathematics, 21.06.2019 15:20
Abcd ≅ klmn ≅ pqrs ≅ wxyz given that information, which figures are reflections of abcd?
Answers: 1
Mathematics, 21.06.2019 15:30
Question 7 of 47 1 point what is the equation of a line with a slope of 1/2 that passes through the point, (-2,5)? o a. 1/2x+3 o b. y=1/2x+5 o c. y=x+5 o d. y=1/2x+6
Answers: 3
Mathematics, 21.06.2019 16:10
20 da is equal to a. 2,000 cm. b. 2 m. c. 20,000 cm. d. 20,000 mm
Answers: 1
Mathematics, 21.06.2019 18:30
Idon’t understand! use slope intercept form to solve: through: (2,5) slope= undefined
Answers: 1
You know the right answer?
The population of fish in a pond in relation to the number of years since stocking is depicted on a...
Questions
Mathematics, 18.05.2021 23:20

Mathematics, 18.05.2021 23:20
Mathematics, 18.05.2021 23:20

Spanish, 18.05.2021 23:20
Engineering, 18.05.2021 23:20

Mathematics, 18.05.2021 23:20

Mathematics, 18.05.2021 23:20
English, 18.05.2021 23:20


