
Mathematics, 22.01.2021 17:00 kellysimkin6196
Select the correct answer.
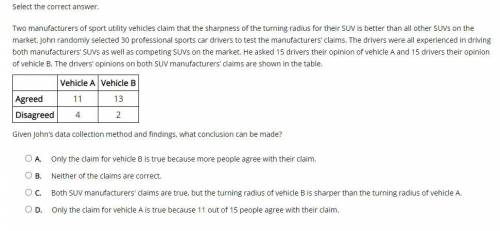
Two manufacturers of sport utility vehicles claim that the sharpness of the turning radius for their SUV is better than all other SUVs on the market. John randomly selected 30 professional sports car drivers to test the manufacturers’ claims. The drivers were all experienced in driving both manufacturers’ SUVs as well as competing SUVs on the market. He asked 15 drivers their opinion of vehicle A and 15 drivers their opinion of vehicle B. The drivers’ opinions on both SUV manufacturers’ claims are shown in the table.
Given John’s data collection method and findings, what conclusion can be made?
A.
Only the claim for vehicle B is true because more people agree with their claim.
B.
Neither of the claims are correct.
C.
Both SUV manufacturers' claims are true, but the turning radius of vehicle B is sharper than the turning radius of vehicle A.
D.
Only the claim for vehicle A is true because 11 out of 15 people agree with their claim.

Answers: 2
Another question on Mathematics
Mathematics, 21.06.2019 15:00
Tell me how you got the it use the figures to answer questions 1and 2. in each diagram, line k is parallel to line l, and line t intersects lines. 1. based on the diagrams, what is the value of x? 2. how would you verify your answer for x?
Answers: 1
Mathematics, 21.06.2019 16:30
Which approach to the theory-and-research cycle does the following sequence reflect: (1) specific observations suggest generalizations, (2) generalizations produce a tentative theory, (3) the theory is tested through the formation of hypotheses, and (4) hypotheses may provide suggestions for additional observations?
Answers: 1
Mathematics, 21.06.2019 17:10
The frequency table shows a set of data collected by a doctor for adult patients who were diagnosed with a strain of influenza. patients with influenza age range number of sick patients 25 to 29 30 to 34 35 to 39 40 to 45 which dot plot could represent the same data as the frequency table? patients with flu
Answers: 2
You know the right answer?
Select the correct answer.
Two manufacturers of sport utility vehicles claim that the sharpness of...
Questions

Social Studies, 12.07.2019 17:00
Social Studies, 12.07.2019 17:00

History, 12.07.2019 17:00
History, 12.07.2019 17:00

English, 12.07.2019 17:00

Health, 12.07.2019 17:00
Mathematics, 12.07.2019 17:00
Mathematics, 12.07.2019 17:00

Mathematics, 12.07.2019 17:00
History, 12.07.2019 17:00

Health, 12.07.2019 17:00
Social Studies, 12.07.2019 17:00
History, 12.07.2019 17:00
Mathematics, 12.07.2019 17:00
History, 12.07.2019 17:00


