(05.01)
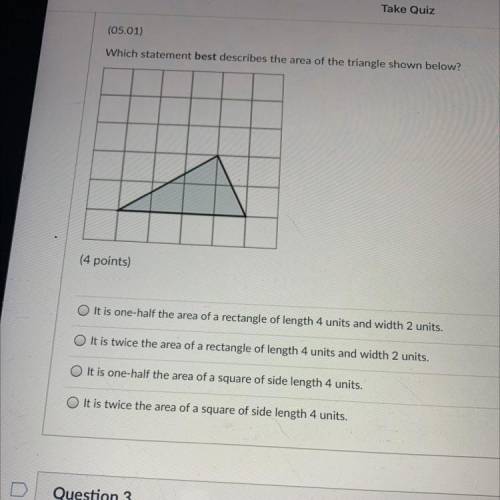
Which statement best describes the area of the triangle shown below?
(4 points)
...

Mathematics, 22.01.2021 18:50 kraigstlistt
(05.01)
Which statement best describes the area of the triangle shown below?
(4 points)
O It is one-half the area of a rectangle of length 4 units and width 2 units.
d
It is twice the area of a rectangle of length 4 units and width 2 units.
It is one-half the area of a square of side length 4 units.
O It is twice the area of a square of side length 4 units.

Answers: 1
Another question on Mathematics
Mathematics, 21.06.2019 18:00
Find the perimeter of the figure shown above. a. 18 yds c. 20 yds b. 10 yds d. 24 yds select the best answer from the choices provided
Answers: 1
Mathematics, 21.06.2019 19:30
Joel wants to buy a new tablet computer fram a store having a 20% off sale on all tablets. the tablet he wants has an original cost of $190. he also wants to make sure he has enough money to pay the 5% sales tax. part one joel uses the incorect expression 0.95(190)(0.8) to calculate that the tablet will cost him a total of $144.40. describe his error and write the correct expression part two how much will joel pay for the tablet show your work if you answer this question correctly you will receive a prize of 99 points good luck
Answers: 2
Mathematics, 22.06.2019 01:00
The weight of 46 new patients of a clinic from the year 2018 are recorded and listed below. construct a frequency distribution, using 7 classes. then, draw a histogram, a frequency polygon, and an ogive for the data, using the relative information from the frequency table for each of the graphs. describe the shape of the histogram. data set: 130 192 145 97 100 122 210 132 107 95 210 128 193 208 118 196 130 178 187 240 90 126 98 194 115 212 110 225 187 133 220 218 110 104 201 120 183 124 261 270 108 160 203 210 191 180 1) complete the frequency distribution table below (add as many rows as needed): - class limits - class boundaries - midpoint - frequency - cumulative frequency 2) histogram 3) frequency polygon 4) ogive
Answers: 1
Mathematics, 22.06.2019 01:30
At store a, erasers are sold individually. the cost y of x erasers is represented by the equation y=0.75x. the costs of erasers at store b are shown in the graph.
Answers: 2
You know the right answer?
Questions

Mathematics, 28.01.2020 07:31
Mathematics, 28.01.2020 07:31
Mathematics, 28.01.2020 07:31

Chemistry, 28.01.2020 07:31

History, 28.01.2020 07:31
Mathematics, 28.01.2020 07:31
History, 28.01.2020 07:31
Mathematics, 28.01.2020 07:31
Mathematics, 28.01.2020 07:31

Biology, 28.01.2020 07:31
Mathematics, 28.01.2020 07:31
Mathematics, 28.01.2020 07:31
Mathematics, 28.01.2020 07:31
Mathematics, 28.01.2020 07:31


