Application/8
usal Sharipova Jan 23, 2011
1. The following data set represents the heights of...

Mathematics, 22.01.2021 19:50 MK100
Application/8
usal Sharipova Jan 23, 2011
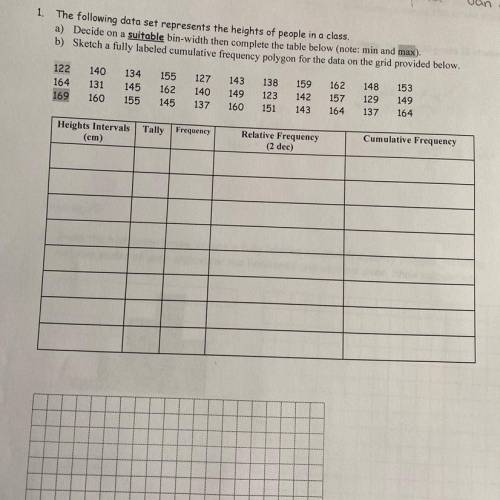
1. The following data set represents the heights of people in a class.
a) Decide on a suitable bin-width then complete the table below (note: min and max)
b) Sketch a fully labeled cumulative frequency polygon for the data on the grid provided below.
122
140
134 155 127 143 138 159 162 148 153
164
131 145
162
140 149 123 142 157 129 149
169 160 155 145 137 160 151 143 164
137
164
Cumulative Frequency
Heights Intervals Tally Frequency
(cm)
Relative Frequency
(2 dec)

Answers: 1
Another question on Mathematics
Mathematics, 21.06.2019 14:00
How can you find the conditional probability of a given b as the fraction of b’s outcomes that also belong to a, and interpret the answer in terms of the model? i just need a good explanation
Answers: 2
Mathematics, 21.06.2019 14:40
1. what is the phythaforean theorem? 2.what do we use it for? 1.what is the distance formula ? 2.what do we use it for?
Answers: 2
Mathematics, 21.06.2019 17:30
Assume that 1400 births are randomly selected and 1378 of the births are girls. use subjective judgment to describe the number of girls as significantly high, significantly low, or neither significantly low nor significantly high. choose the correct answer below. a. the number of girls is neither significantly low nor significantly high. b. the number of girls is significantly high. c. the number of girls is significantly low. d. it is impossible to make a judgment with the given information.
Answers: 1
Mathematics, 21.06.2019 18:40
What is the value of the expression below? 148+(-6)| + |– 35= 7|
Answers: 2
You know the right answer?
Questions


Geography, 04.02.2020 20:45

History, 04.02.2020 20:45

Computers and Technology, 04.02.2020 20:45


Social Studies, 04.02.2020 20:45
Mathematics, 04.02.2020 20:45
History, 04.02.2020 20:45

Physics, 04.02.2020 20:45

Biology, 04.02.2020 20:45
History, 04.02.2020 20:45


