
Mathematics, 26.01.2021 23:20 kev9369
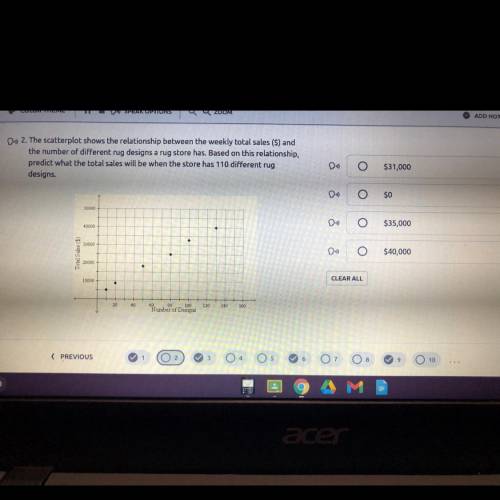
The scatterplot shows the relationship between the weekly total sales (S) and
the number of different rug designs a rug store has. Based on this relationship,
predict what the total sales will be when the store has 110 different rug
designs

Answers: 1
Another question on Mathematics
Mathematics, 21.06.2019 18:30
This is my question~~ ( r ^ 4 - 2r ^ 3 - 23 r ^ 2 - 4r - 32)÷(r+4) ~~ i must use long division to solve it : / i was wondering if anyone world like to solve it. and if so, share step-by-step explanations! you! ❤
Answers: 2
Mathematics, 21.06.2019 19:50
Table which ratio is equivalent to 3: 7? 6: 7 3: 21 24: 56 15: 30
Answers: 1
Mathematics, 22.06.2019 01:00
The collection of beautiful oil paintings currently on display at an art gallery well defined; set not well defined; not a set
Answers: 2
Mathematics, 22.06.2019 02:00
Pleasseee important quick note: enter your answer and show all the steps that you use to solve this problem in the space provided. use the circle graph shown below to answer the question. a pie chart labeled favorite sports to watch is divided into three portions. football represents 42 percent, baseball represents 33 percent, and soccer represents 25 percent. if 210 people said football was their favorite sport to watch, how many people were surveyed?
Answers: 1
You know the right answer?
The scatterplot shows the relationship between the weekly total sales (S) and
the number of differe...
Questions
Mathematics, 30.06.2019 03:00

Health, 30.06.2019 03:00
Mathematics, 30.06.2019 03:00
Mathematics, 30.06.2019 03:00
Health, 30.06.2019 03:00

Biology, 30.06.2019 03:00


Mathematics, 30.06.2019 03:00
Mathematics, 30.06.2019 03:00
Mathematics, 30.06.2019 03:00


