
Mathematics, 29.01.2021 16:40 joejoefofana
Assume that a simple random sample has been selected and test the given claim. Use the P-value method for testing hypotheses. Identify the null and alternative hypotheses, test statistic, P-value, and state the final conclusion that addresses the original claim. The ages of actresses when they won an acting award is summarized by the statistics n=77, x=35.4 years, and s=11.7 years.
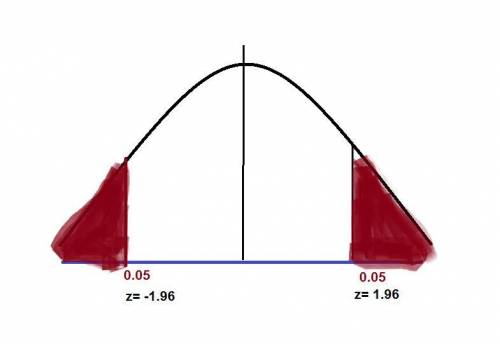
Use a 0.05 significance level to test the claim that the mean age of actresses when they win an acting award is 33 years.
a. What are the hypotheses?
b. Identify the test statistic.
c. Identify the P-value.
d. State the final conclusion that addresses the original claim.
A. Fail to reject H0. There is insufficient evidence to warrant rejection of the claim that the mean age of actresses when they win an acting award is 33 years.
B. Reject H0. There is insufficient evidence to warrant rejection of the claim that the mean age of actresses when they win an acting award is 33 years.
C. Fail to reject H0. There is sufficient evidence to warrant rejection of the claim that the mean age of actresses when they win an acting award is 33 years.
D. Reject H0. There is sufficient evidence to warrant rejection of the claim that the mean age of actresses when they win an acting award is 33 years.

Answers: 2
Another question on Mathematics
Mathematics, 21.06.2019 17:30
The graph below represents the number of dolphins in a dolphin sanctuary. select all the key features of this function.
Answers: 2
Mathematics, 21.06.2019 18:30
Which of the following correctly justifies statement four of the two column proof? a. corresponding angles theorem b. transitive property of equality c. vertical angle theorem d. substitution property of equality
Answers: 1
Mathematics, 21.06.2019 21:30
What is the solution to this system of equations? y= 2x - 3.5 x - 2y = -14
Answers: 2
Mathematics, 21.06.2019 22:50
Listed below are time intervals (min) between eruptions of a geyser. assume that the "recent" times are within the past few years, the "past" times are from around 20 years ago, and that the two samples are independent simple random samples selected from normally distributed populations. do not assume that the population standard deviations are equal. does it appear that the mean time interval has changed? is the conclusion affected by whether the significance level is 0.10 or 0.01? recent 78 90 90 79 57 101 62 87 71 87 81 84 57 80 74 103 62 past 88 89 93 94 65 85 85 92 87 91 89 91 follow the steps of hypothesis testing, including identifying the alternative and null hypothesis, calculating the test statistic, finding the p-value, and making a conclusions about the null hypothesis and a final conclusion that addresses the original claim. use a significance level of 0.10. is the conclusion affected by whether the significance level is 0.10 or 0.01? answer choices below: a) yes, the conclusion is affected by the significance level because h0 is rejected when the significance level is 0.01 but is not rejected when the significance level is 0.10. b) no, the conclusion is not affected by the significance level because h0 is not rejected regardless of whether a significance level of 0.10 or 0.01 is used. c) yes, the conclusion is affected by the significance level because h0 is rejected when the significance level is 0.10 but is not rejected when the significance level is 0.01. d) no, the conclusion is not affected by the significance level because h0 is rejected regardless of whether a significance level of 0.10 or 0.01 is used.
Answers: 3
You know the right answer?
Assume that a simple random sample has been selected and test the given claim. Use the P-value metho...
Questions


Chemistry, 05.07.2019 21:20
Chemistry, 05.07.2019 21:20

Biology, 05.07.2019 21:20


Social Studies, 05.07.2019 21:20

Mathematics, 05.07.2019 21:20

World Languages, 05.07.2019 21:20


