
Mathematics, 31.01.2021 23:10 JDKozlova
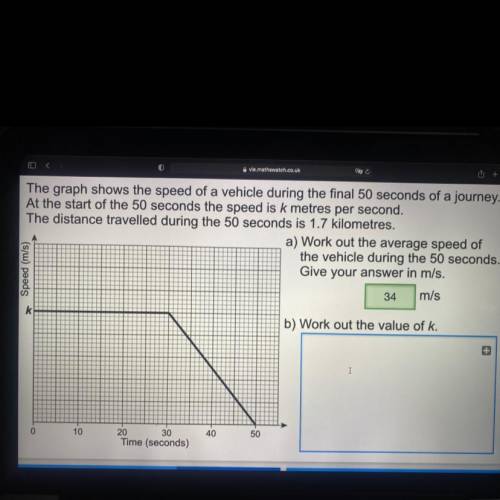
The graph shows the speed of a vehicle during the final 50 seconds of a journey.
At the start of the 50 seconds the speed is k metres per second.
The distance travelled during the 50 seconds is 1.7 kilometres.
a) Work out the average speed of
the vehicle during the 50 seconds.
Give your answer in m/s.
34 m/s
* Speed (m/s)
b) Work out the value of k.
10
40
50
20 30
Time (seconds)

Answers: 3
Another question on Mathematics
Mathematics, 21.06.2019 18:30
Ricky takes out a $31,800 student loan to pay his expenses while he is in college. after graduation, he will begin making payments of $190.66 per month for the next 30 years to pay off the loan. how much more will ricky end up paying for the loan than the original value of $31,800? ricky will end up paying $ more than he borrowed to pay off the loan.
Answers: 1
Mathematics, 21.06.2019 22:30
The difference of three and the reciprocal of a number is equal to the quotient of 20 and the number. find the number.
Answers: 2
Mathematics, 22.06.2019 01:30
When solving a logarithm equation, how do you find the missing variable ?
Answers: 2
You know the right answer?
The graph shows the speed of a vehicle during the final 50 seconds of a journey.
At the start of th...
Questions


Mathematics, 26.09.2019 18:50

Biology, 26.09.2019 18:50

Mathematics, 26.09.2019 18:50

Social Studies, 26.09.2019 18:50
Mathematics, 26.09.2019 18:50

Health, 26.09.2019 18:50
Geography, 26.09.2019 18:50

Business, 26.09.2019 18:50
History, 26.09.2019 18:50
History, 26.09.2019 18:50


