
Mathematics, 01.02.2021 18:20 lovely222
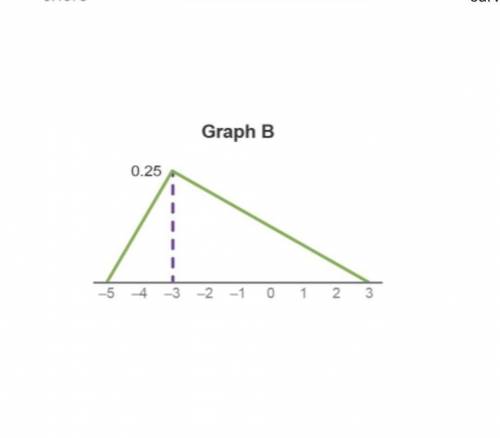
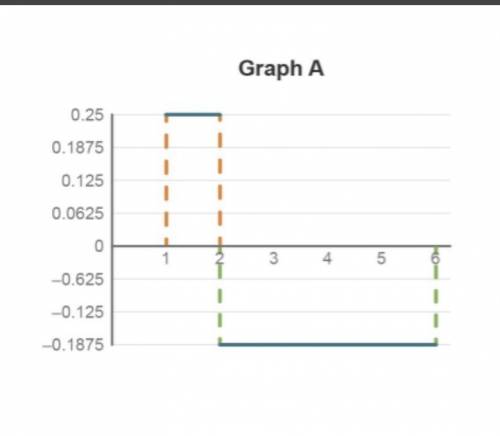
2 graphs. Graph A: a dotted line goes from (1, 0) to (1, 0.25), is solid and horizontal to (2, 0.25), is dotted to (2, negative 0.1875), is solid and horizontal to (6, negative 0.1875), and then is dotted to (6, 0). Graph B. A line goes from (negative 5, 0) to (negative 3, 0.25), and then decreases to (3, 0).
Which statement about the graphs is true?
Graph A is a valid density curve because the part of the graph from 2 to 6 is below the horizontal axis.
Graph A is not a valid density curve because the part of the graph from 1 to 2 is above the horizontal axis.
Graph B is not a valid density curve because part of the horizontal axis has negative values.
Graph B is a valid density curve because the curve is above the horizontal axis, and the area under the curve is 1.

Answers: 1
Another question on Mathematics
Mathematics, 20.06.2019 18:02
How long would it take for a ball dropped from the top of a 576-foot building to hit the ground? round your answer to two decimal places.
Answers: 2
Mathematics, 21.06.2019 15:10
Can (2,3 and square root 10) be sides ona right triangle?
Answers: 1
Mathematics, 21.06.2019 18:00
If f(x) = 4x – 3 and g(x) = 8x + 2, find each function value a.f[g(3)] b.g[f(5)] c.g{f[g(-4)]}
Answers: 3
You know the right answer?
2 graphs. Graph A: a dotted line goes from (1, 0) to (1, 0.25), is solid and horizontal to (2, 0.25)...
Questions


Mathematics, 03.03.2020 02:48

Biology, 03.03.2020 02:48

Social Studies, 03.03.2020 02:48
Mathematics, 03.03.2020 02:48
Mathematics, 03.03.2020 02:49

History, 03.03.2020 02:51
Mathematics, 03.03.2020 02:51
Mathematics, 03.03.2020 02:51
Mathematics, 03.03.2020 02:51


